Infrastructure Metrics for OpenTelemetry
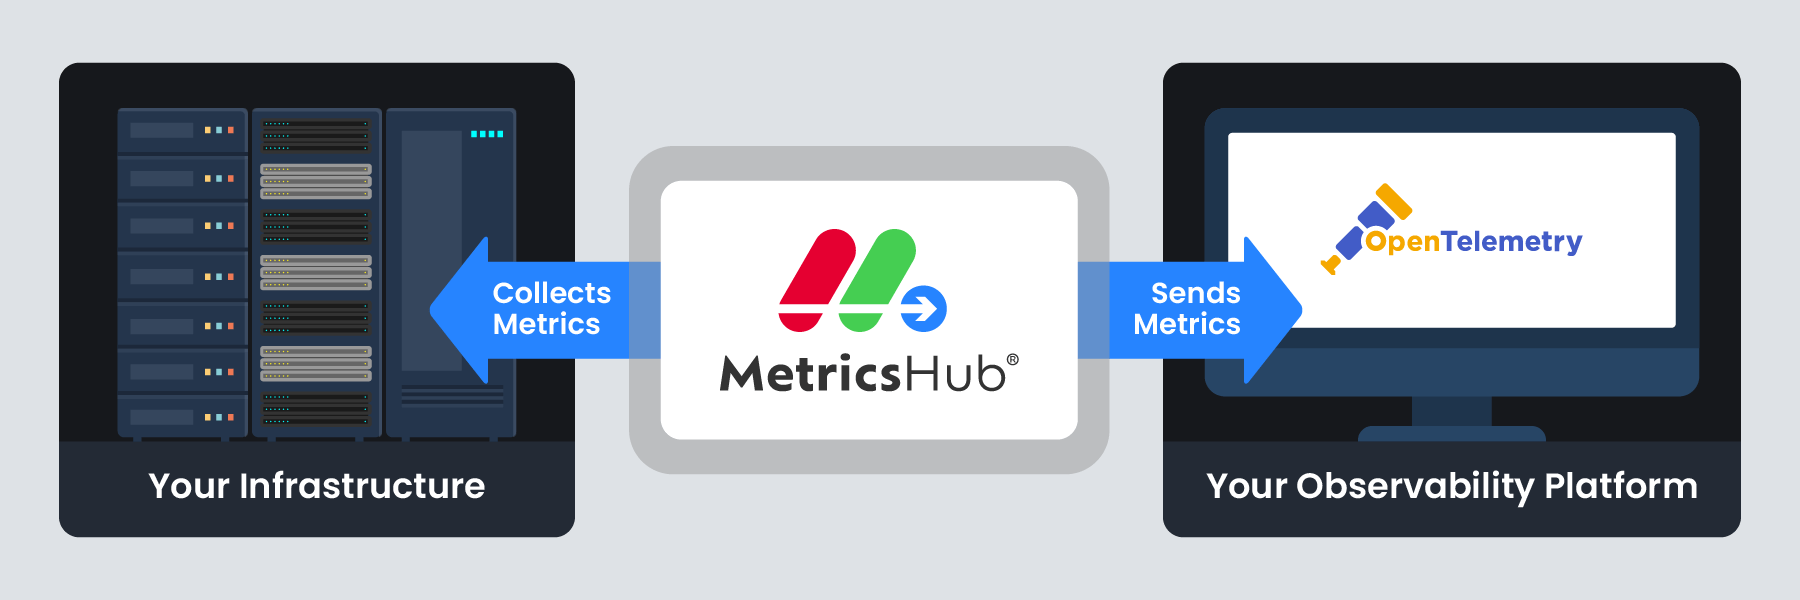
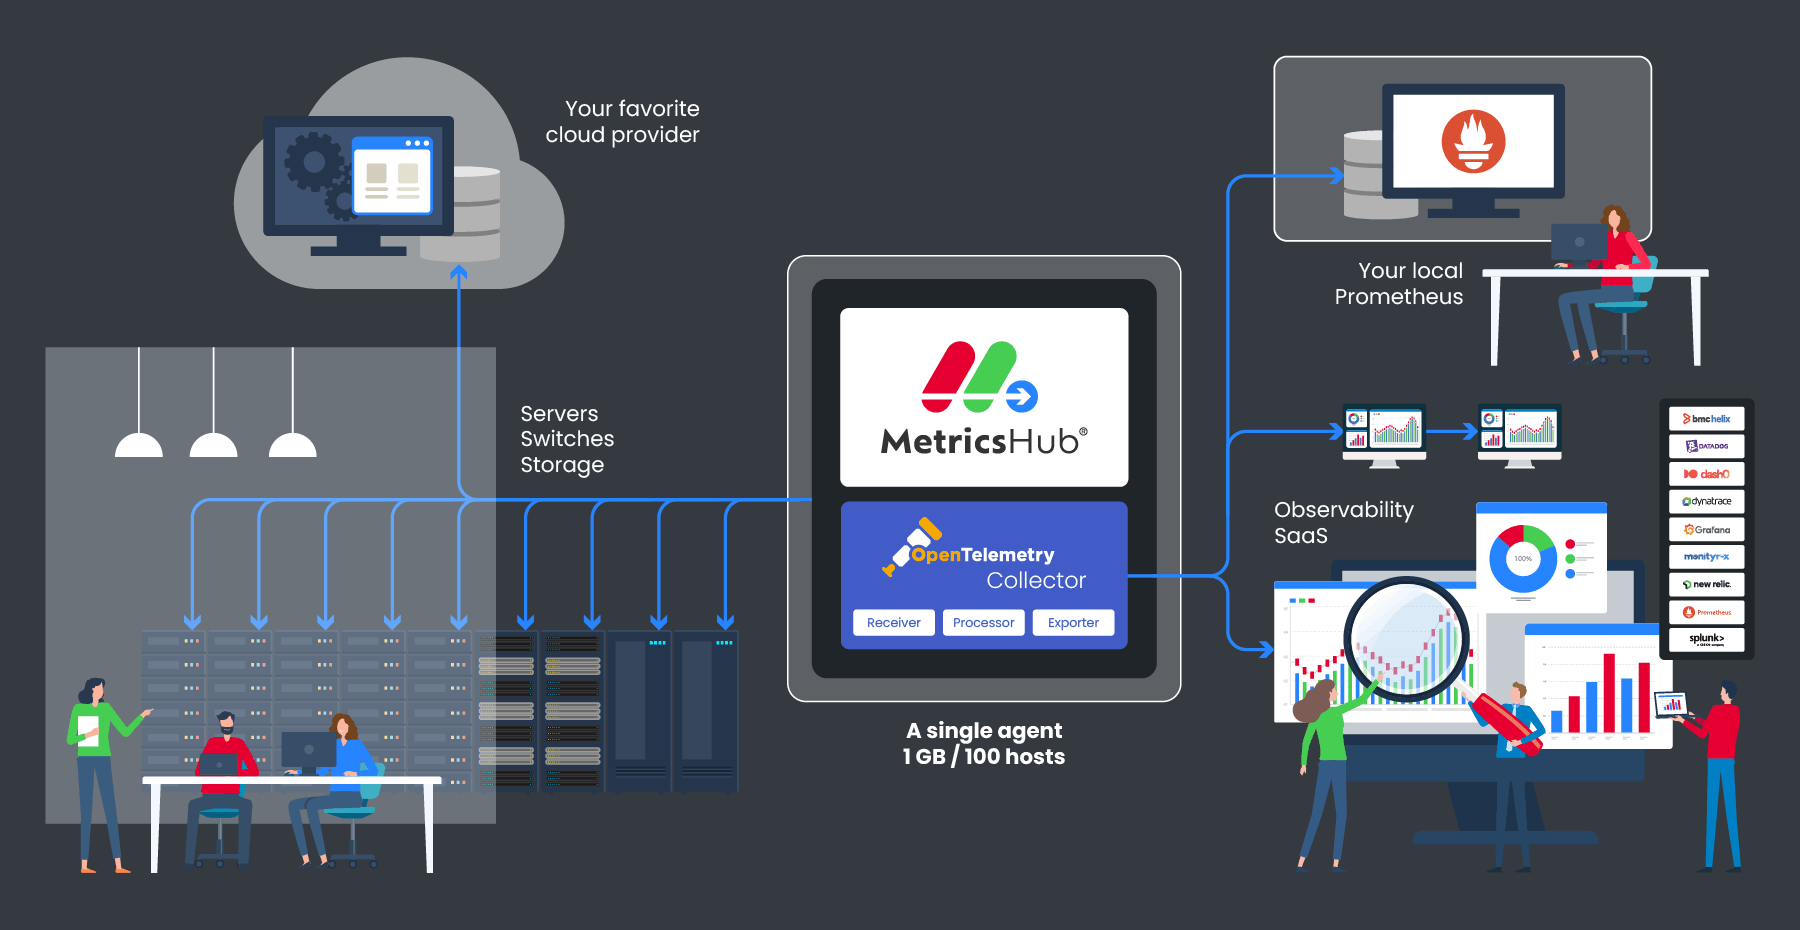
From server hardware to databases, from GPUs to enterprise storage, MetricsHub® is a high-scale collector that monitors up to 1000 remote systems per instance and exports metrics to any OpenTelemetry-compatible backend.
Two Editions to Suit Every Need

Perfect for small-scale and individual projects
Provides essential monitoring

Built for mission-critical environments
Provides advanced monitoring
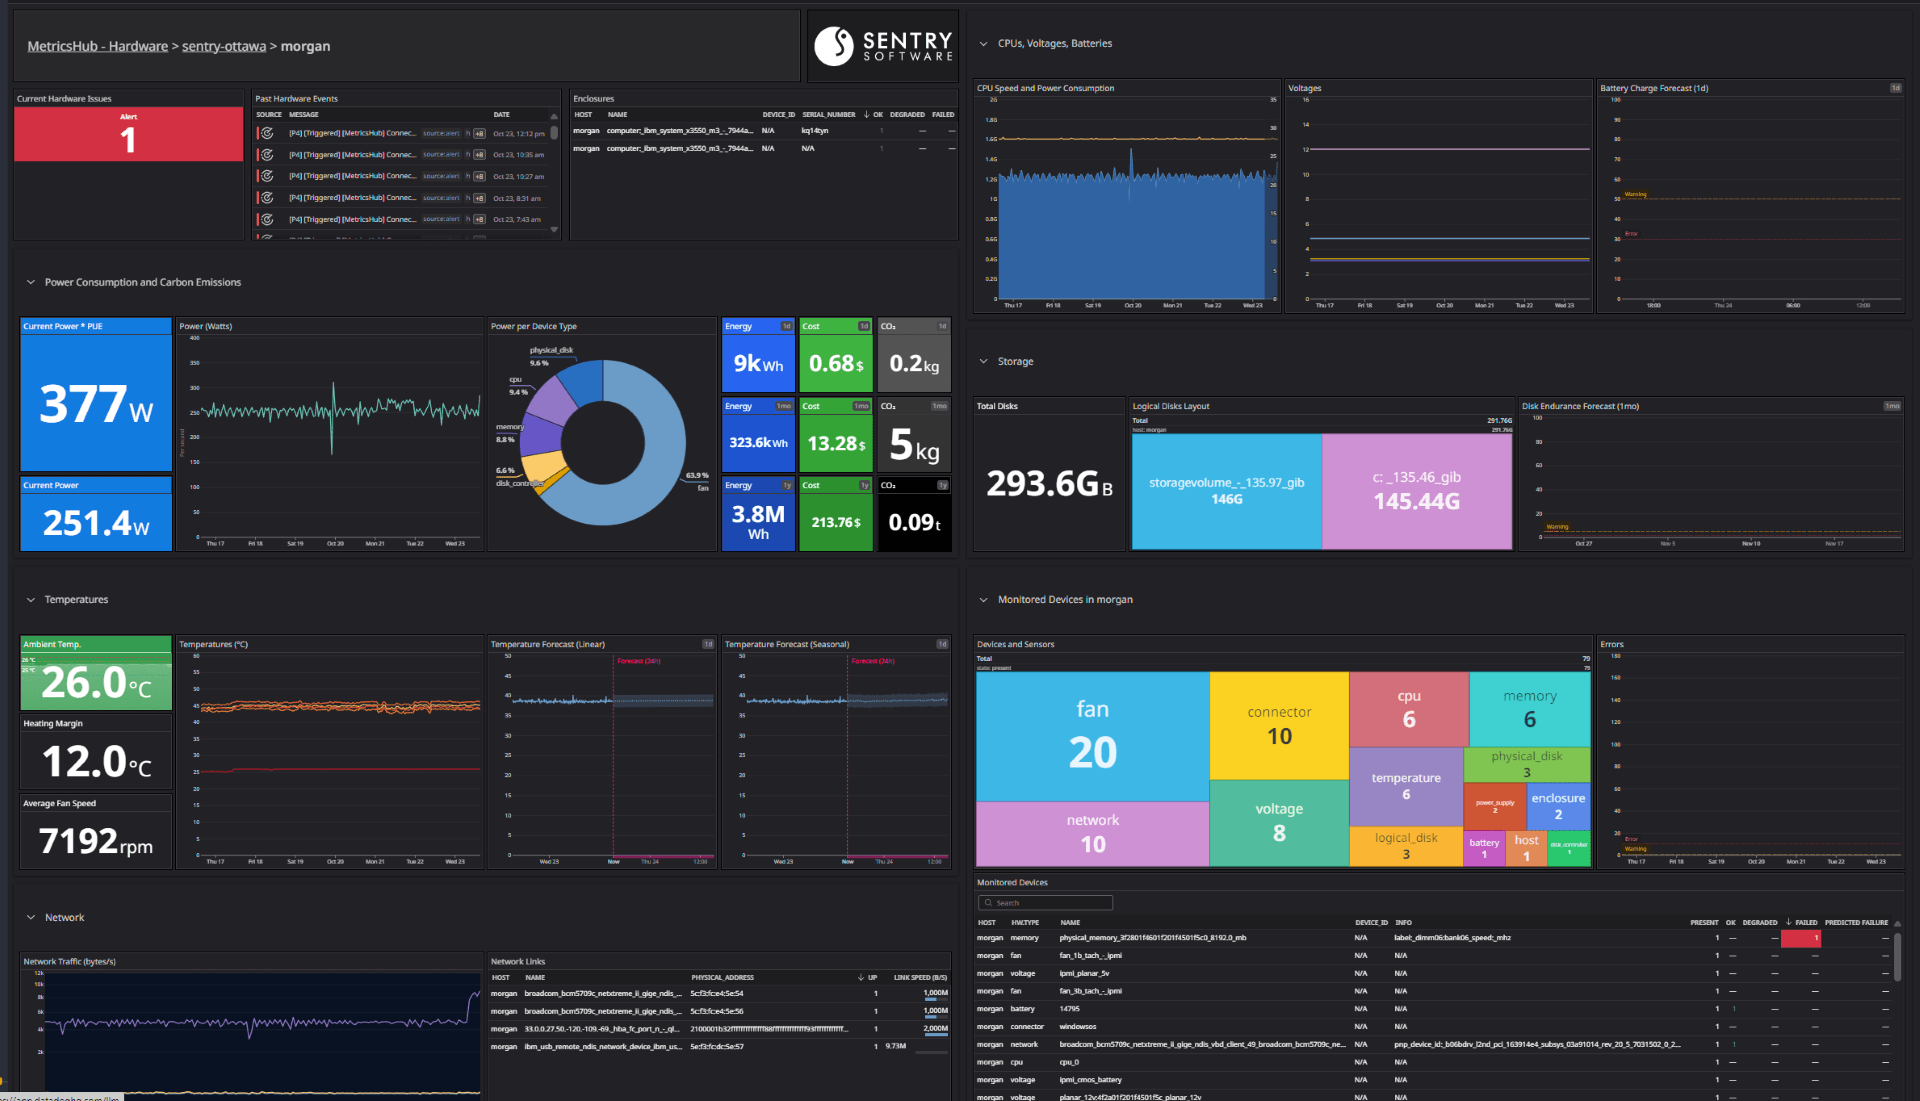
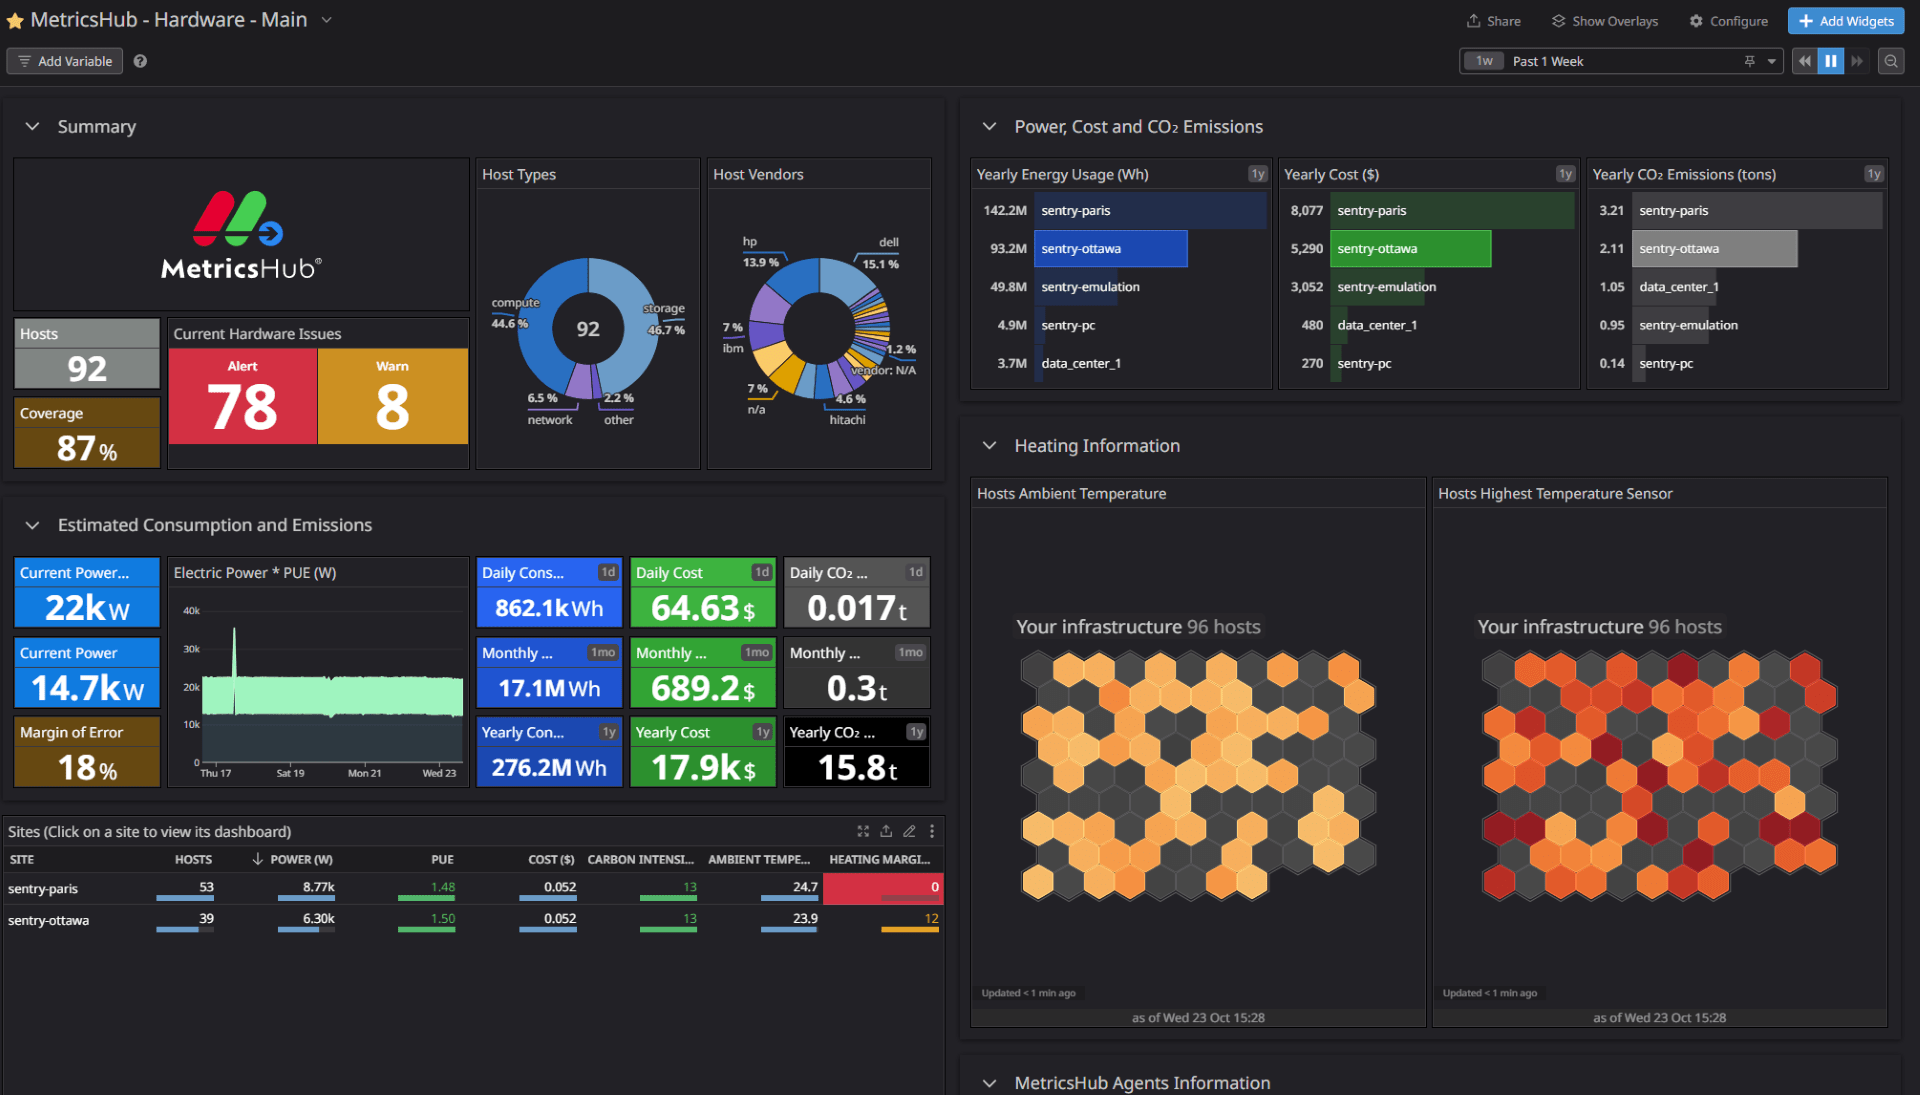
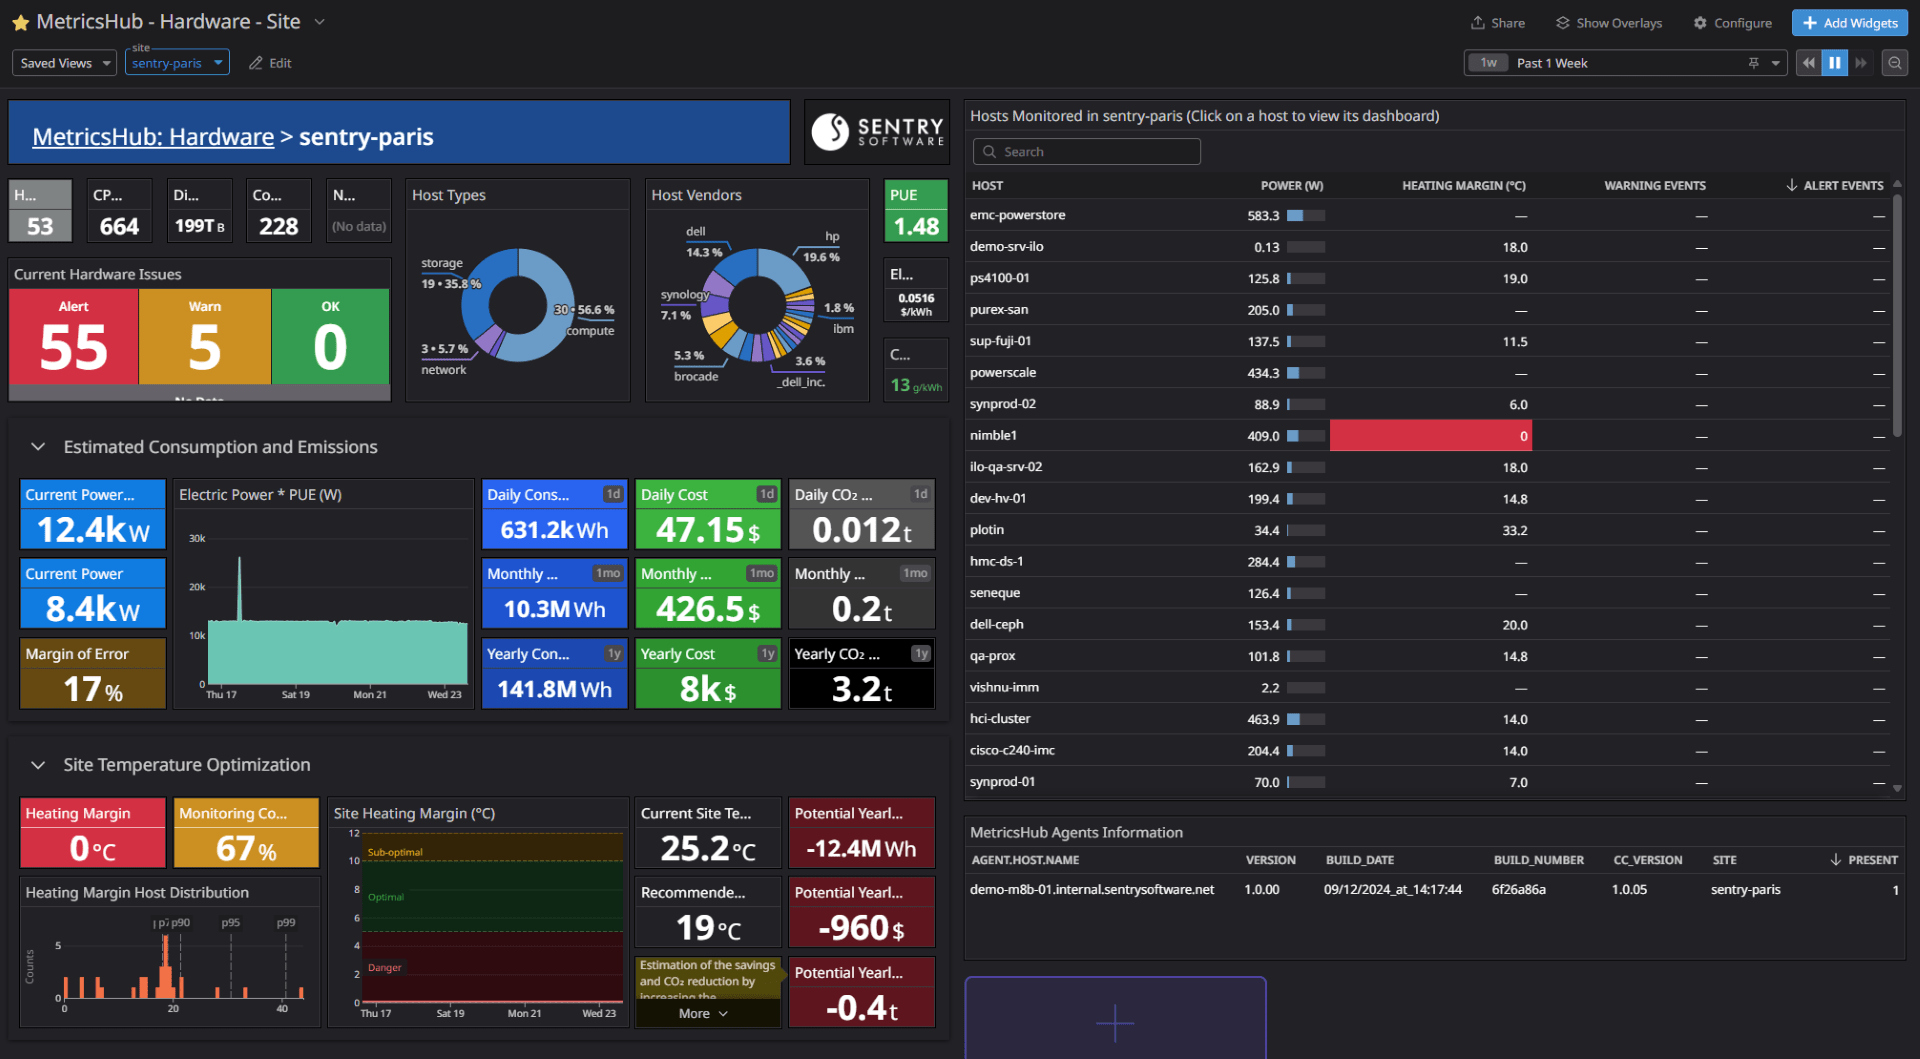
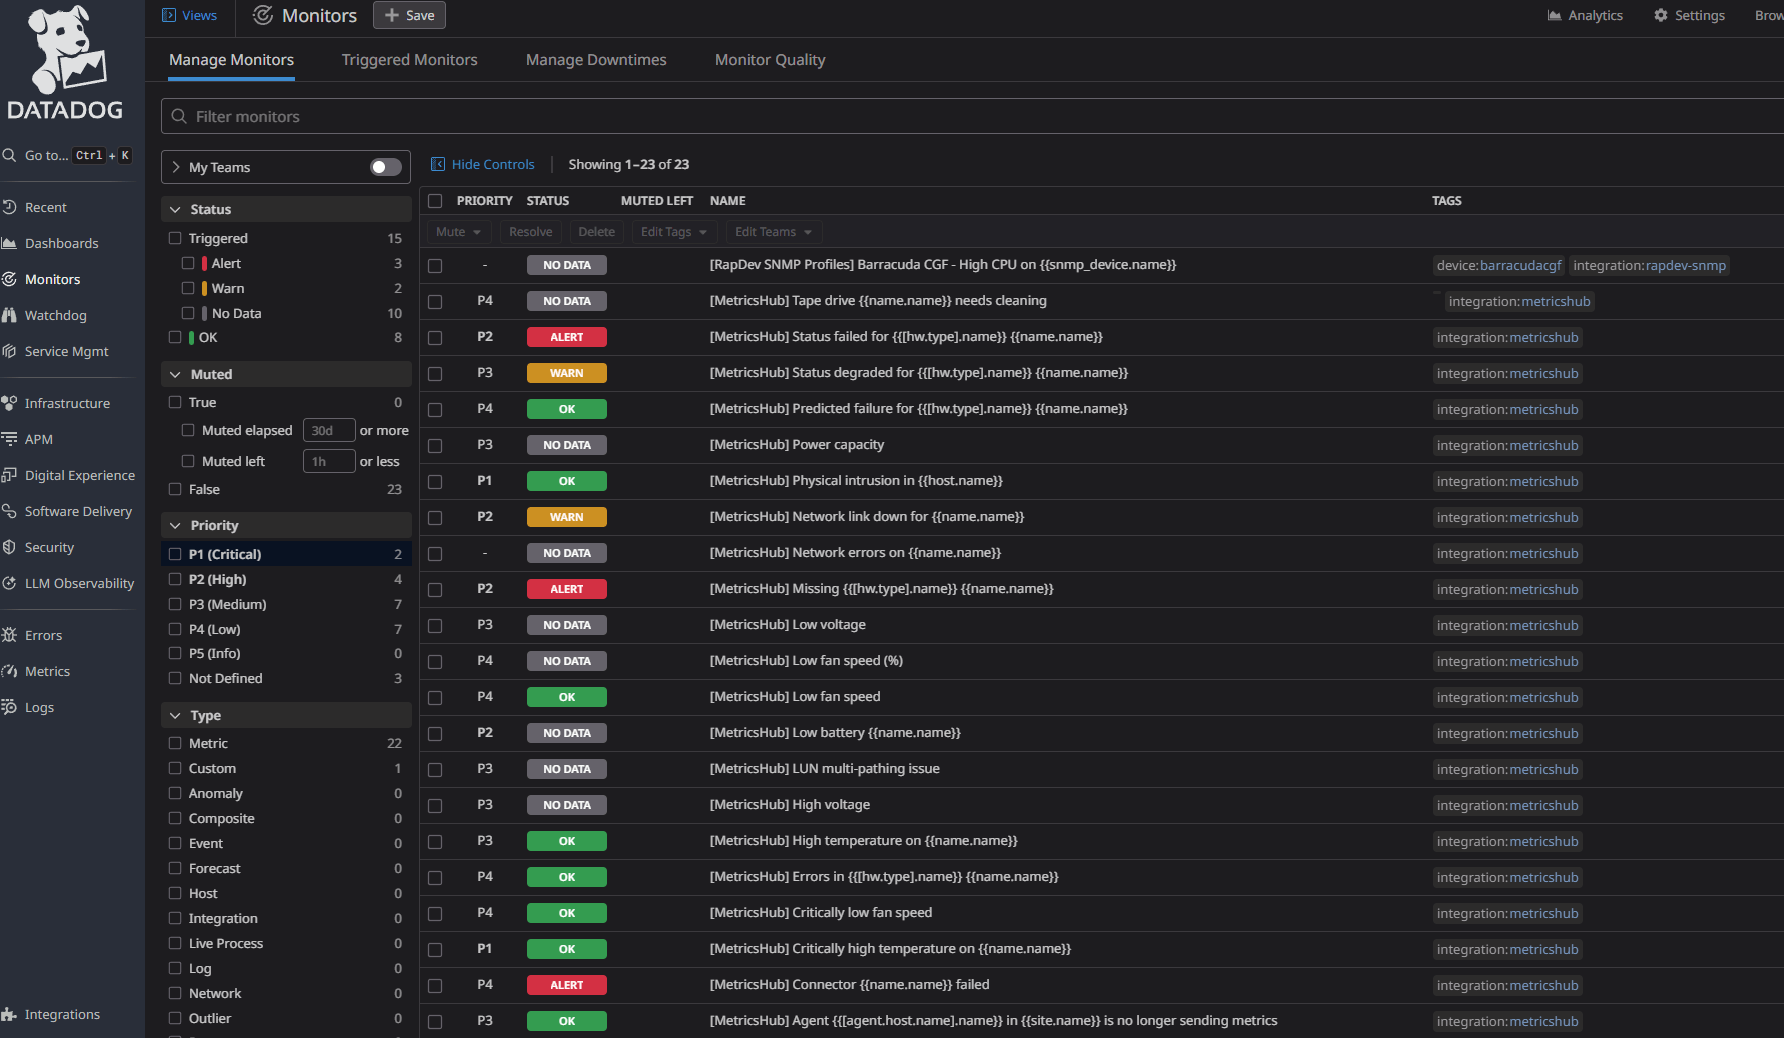
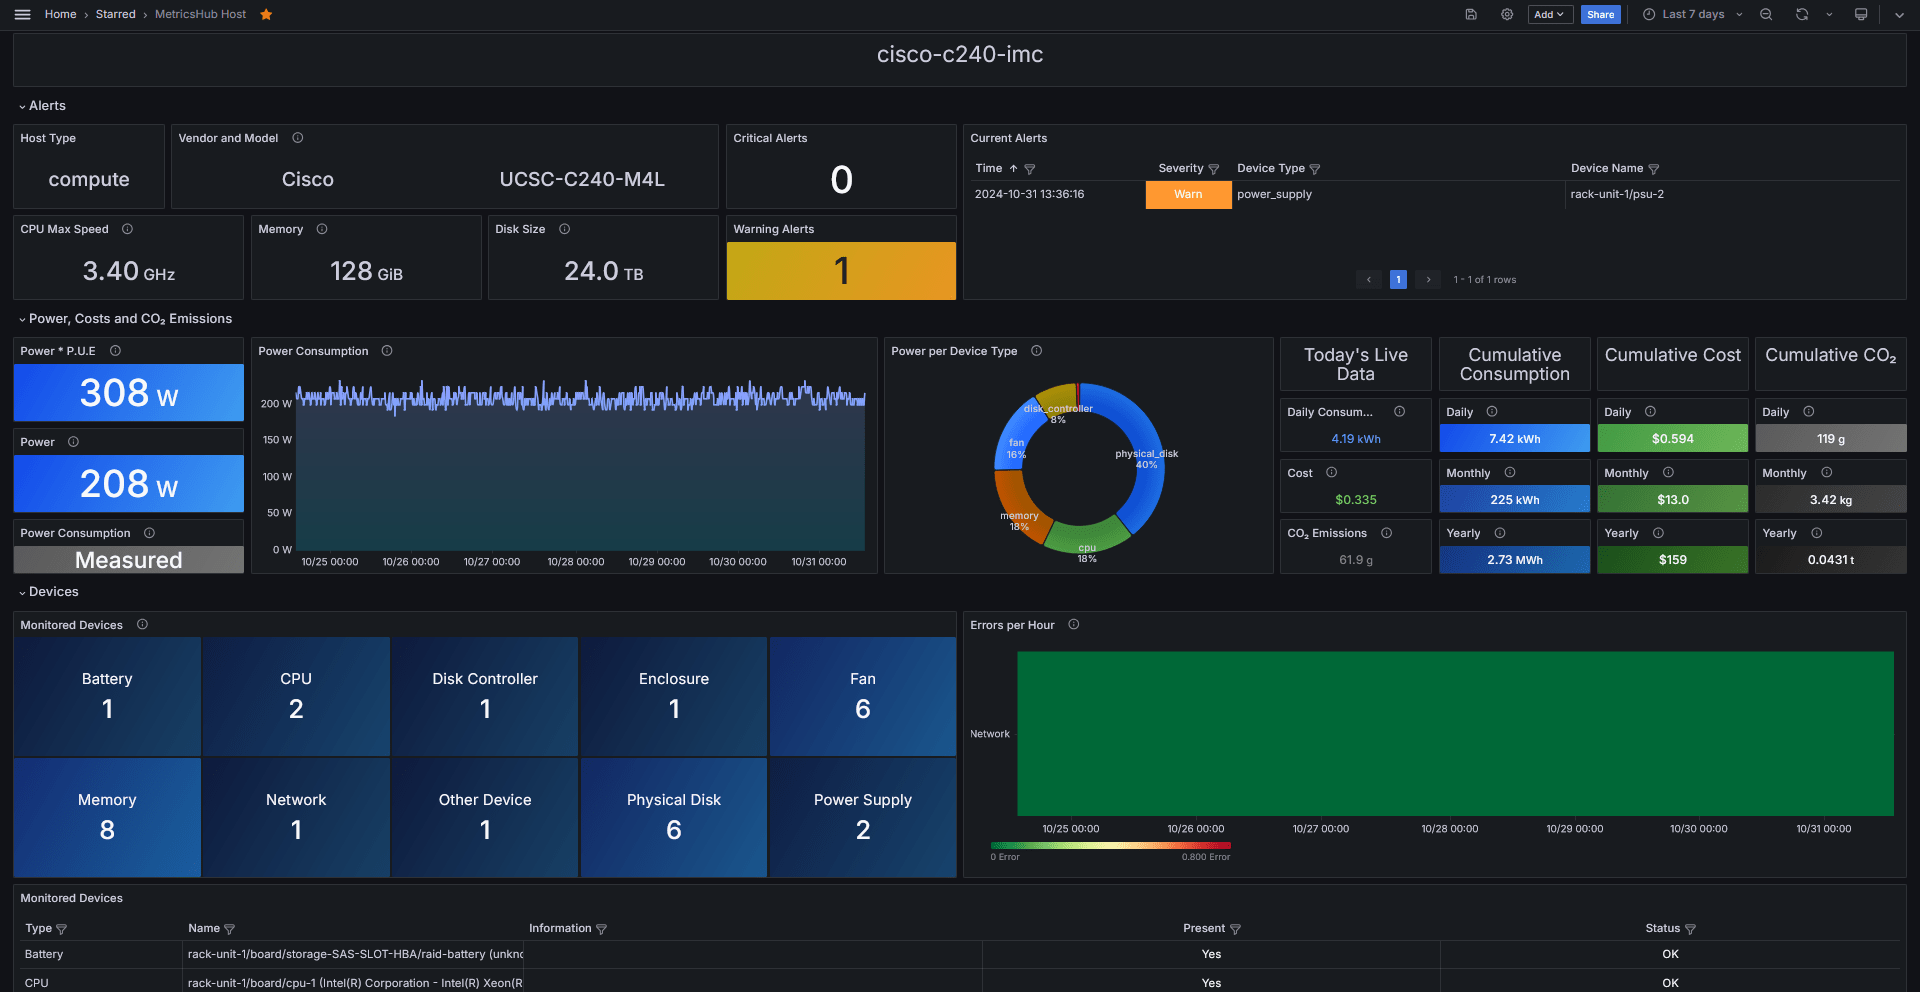
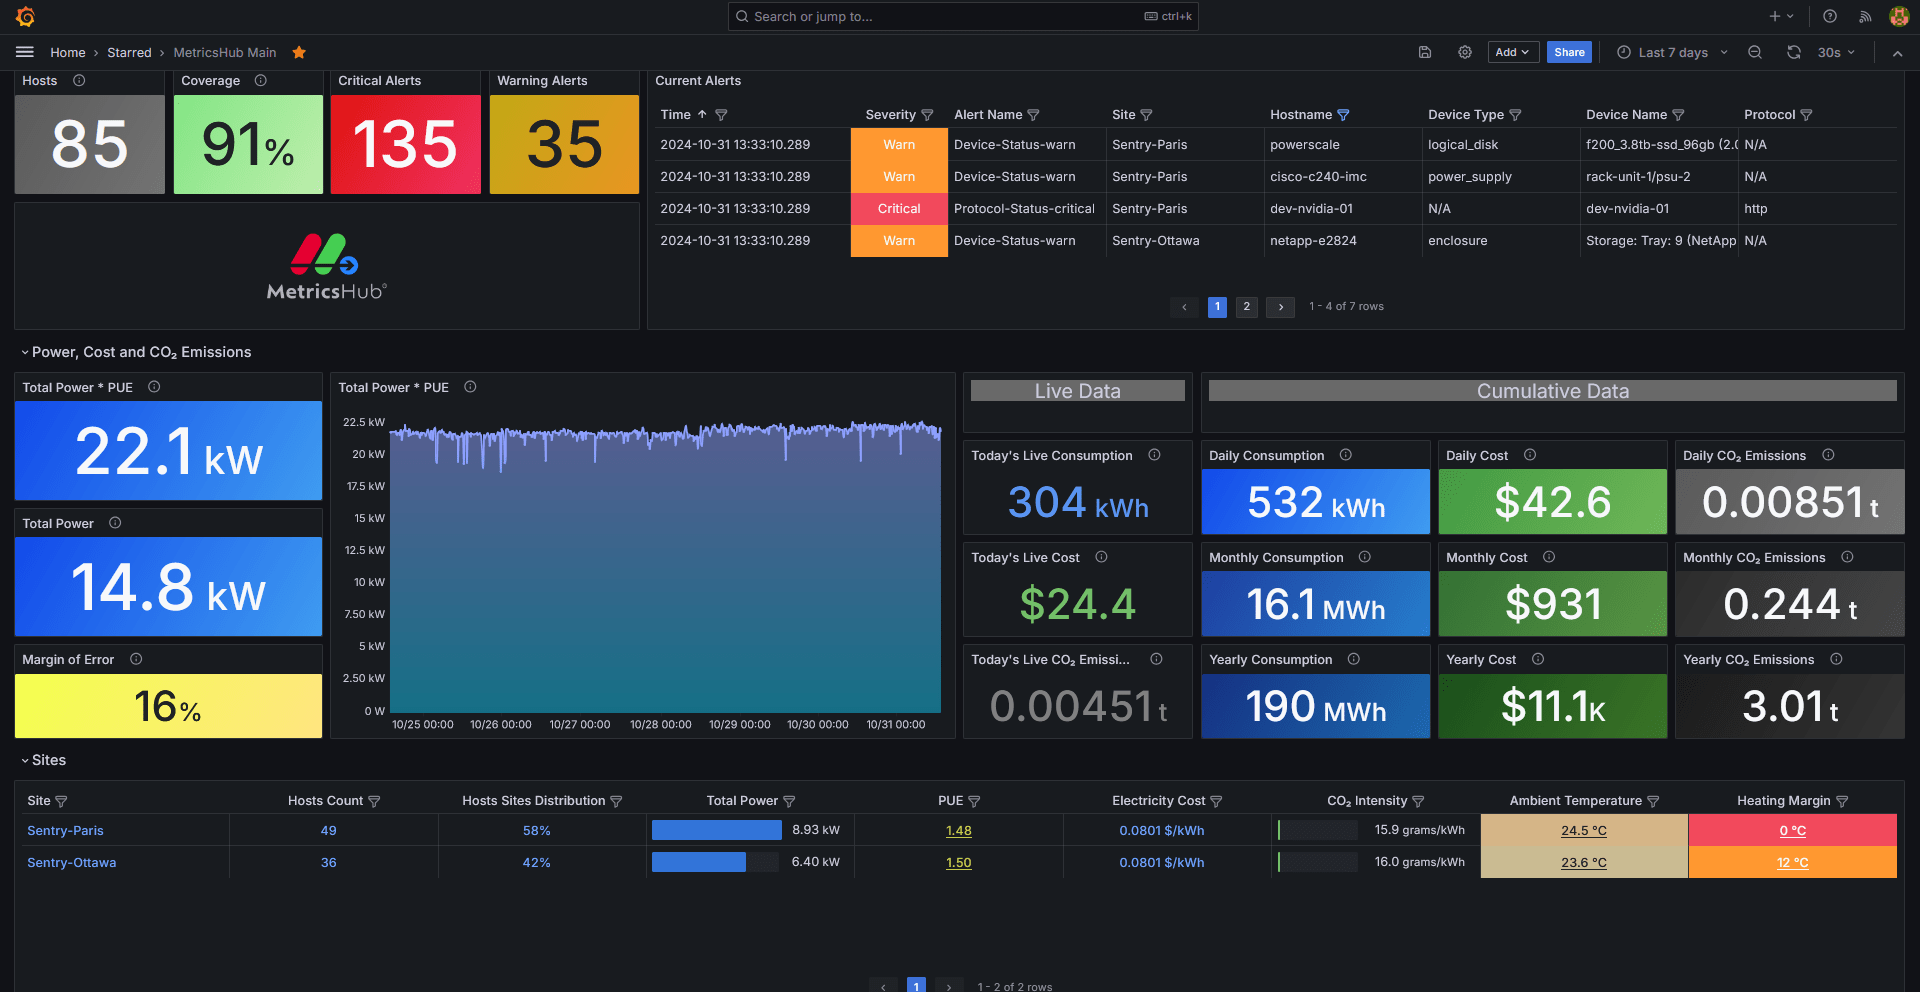
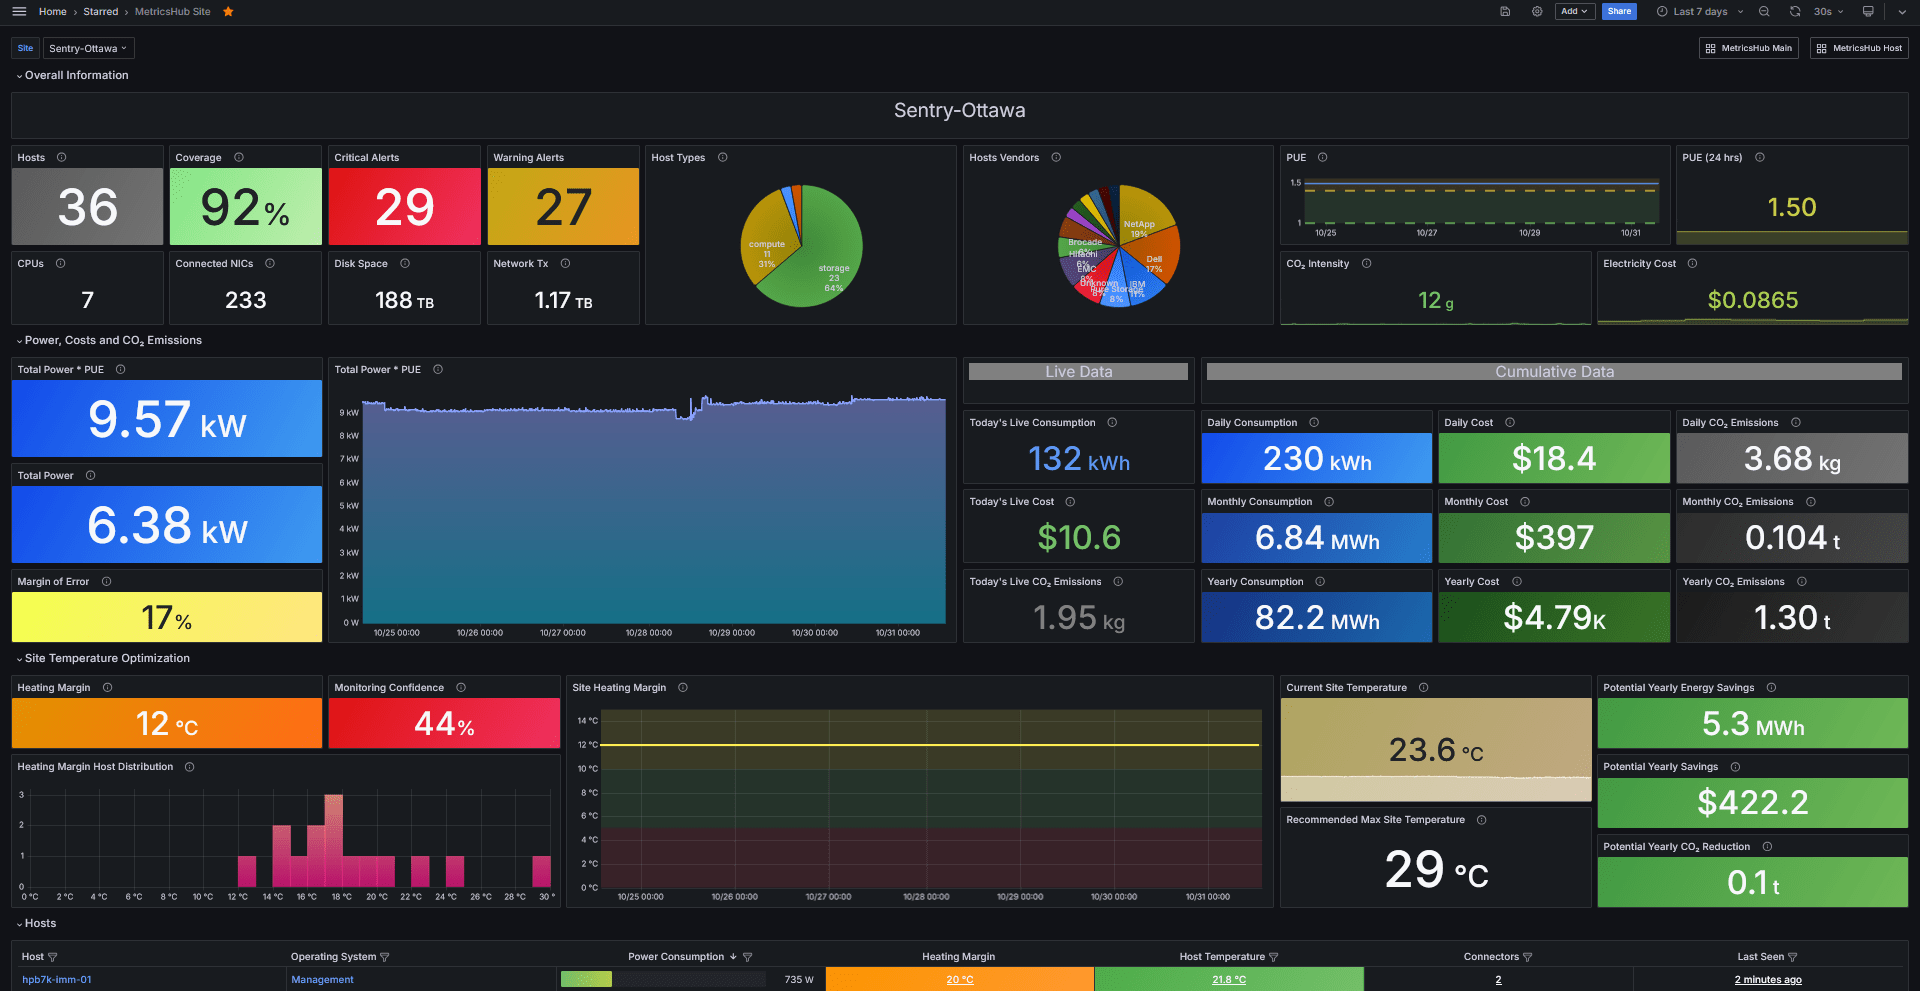
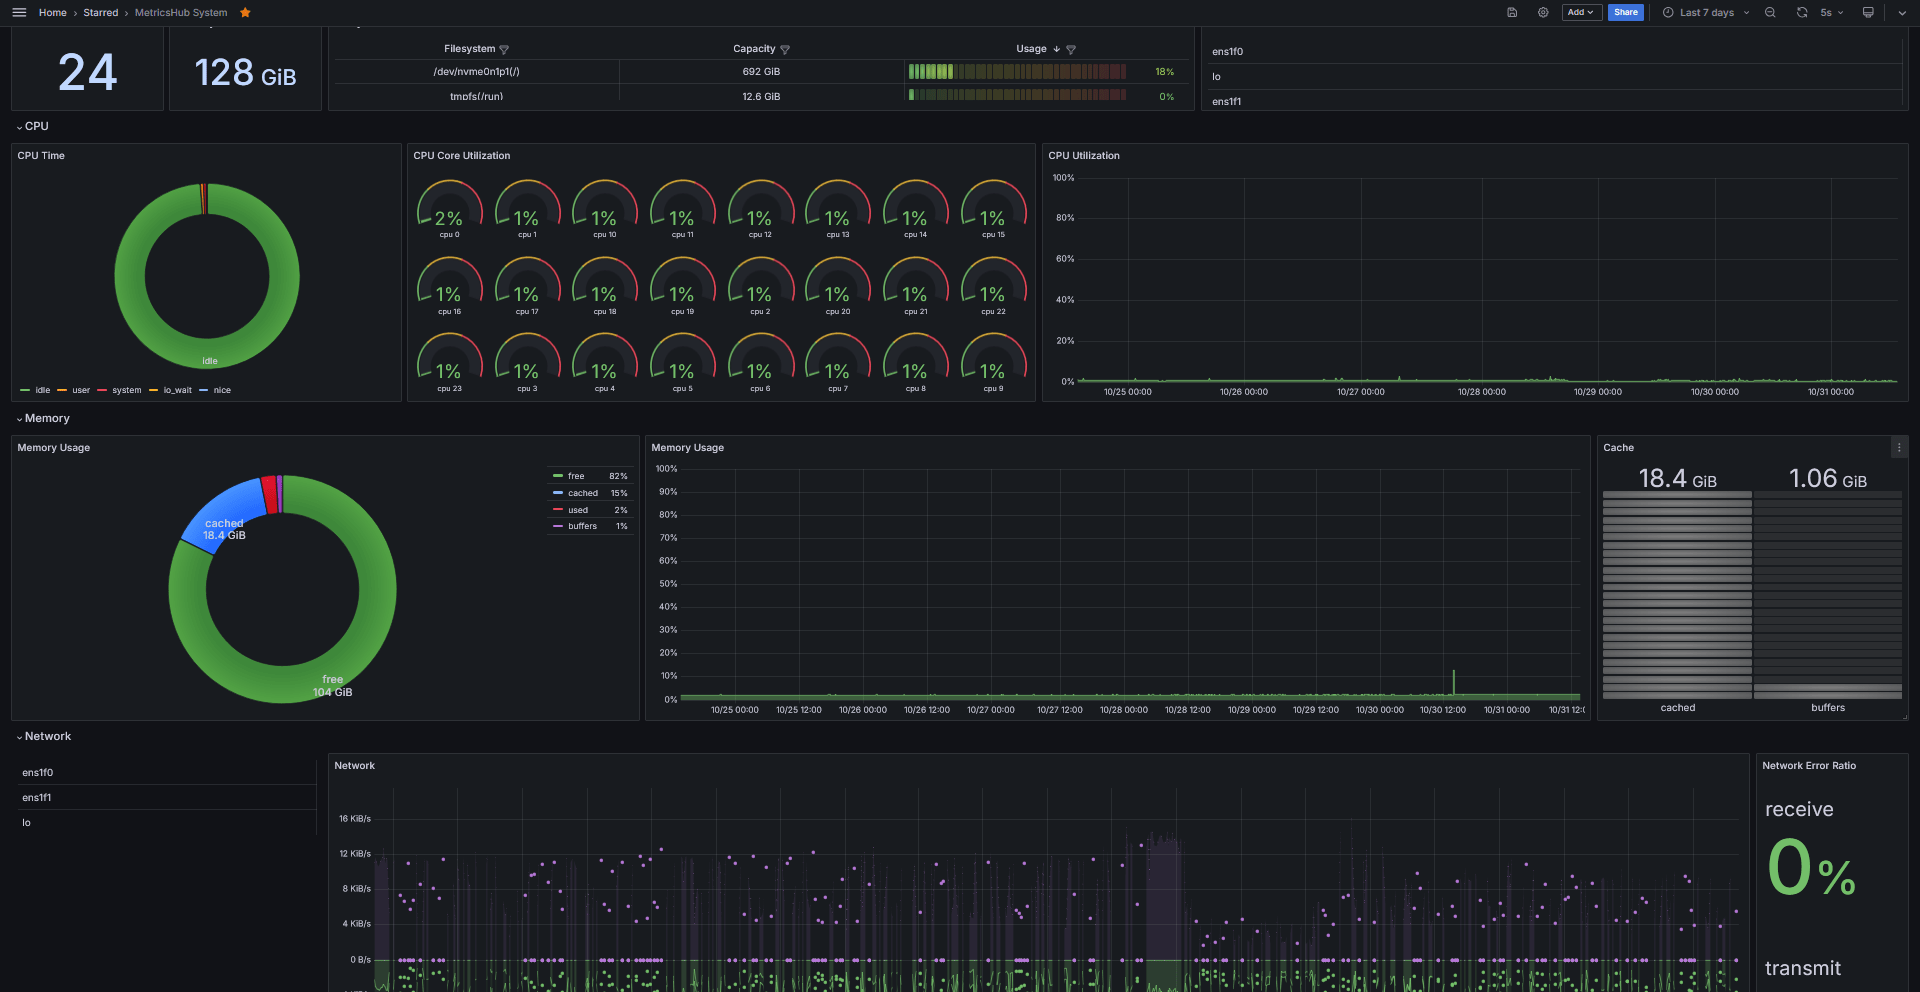
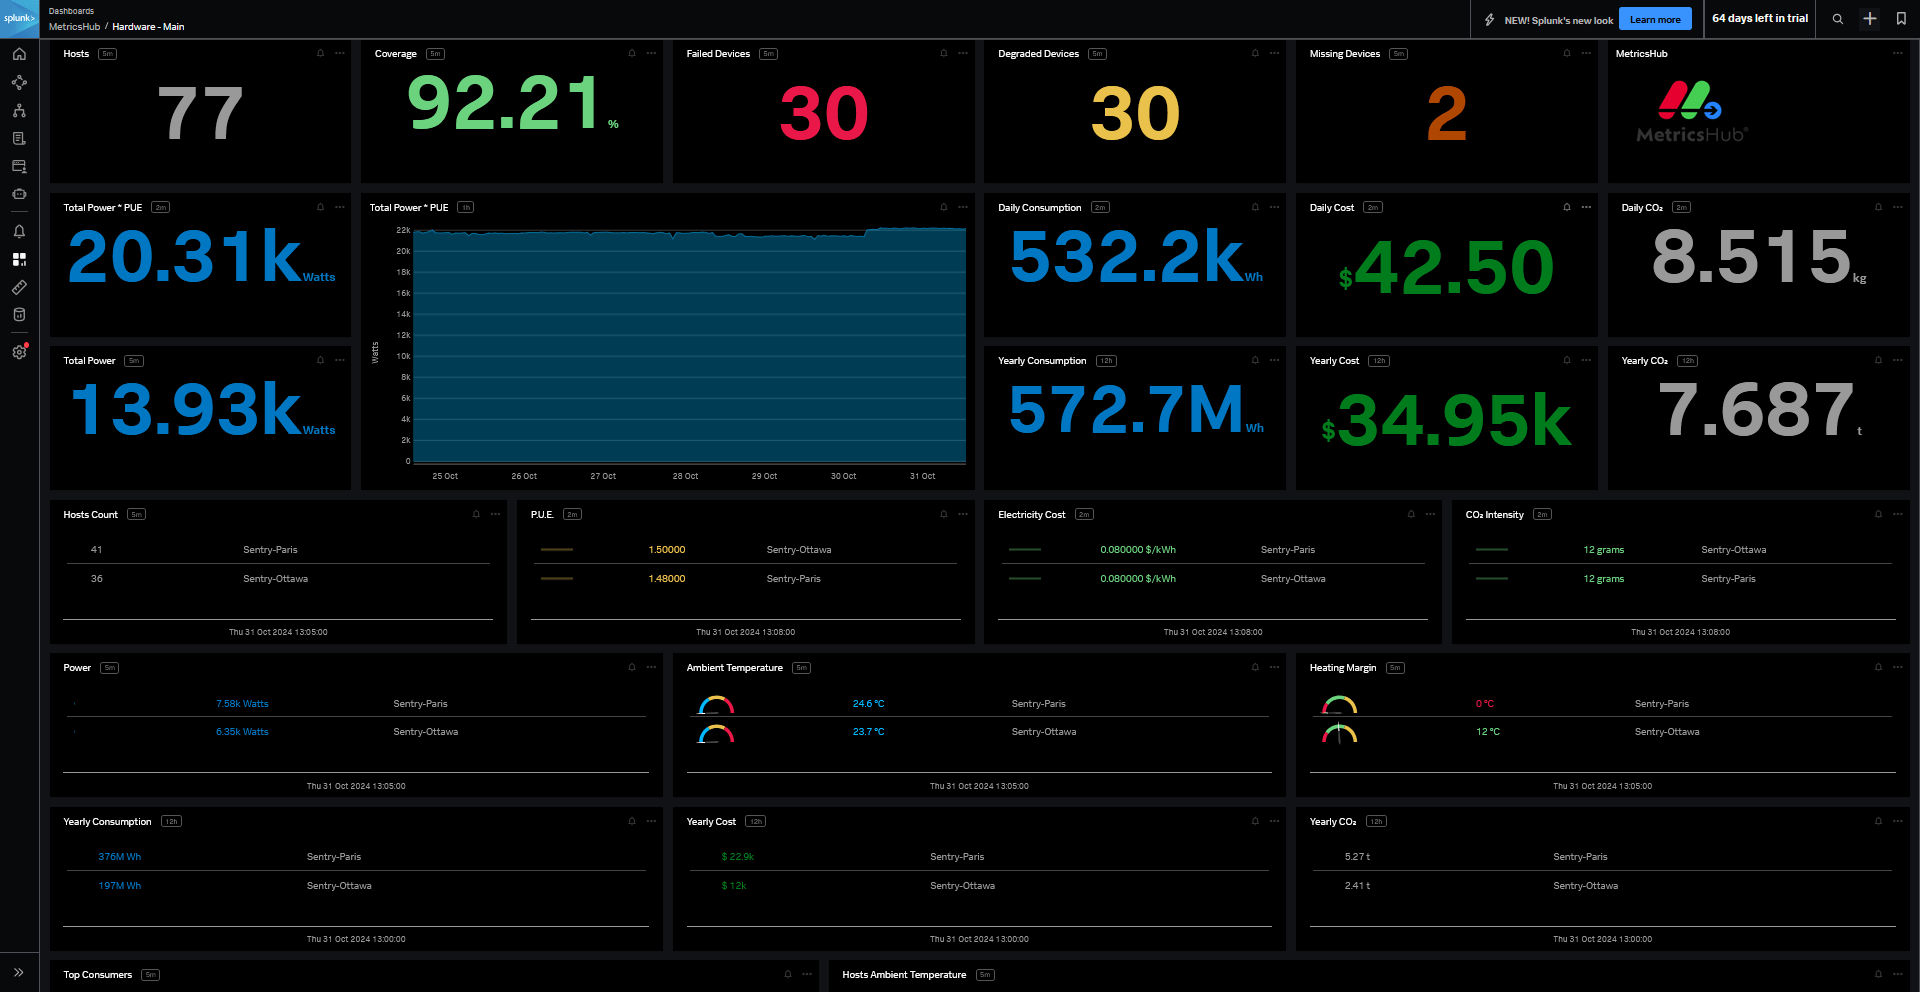
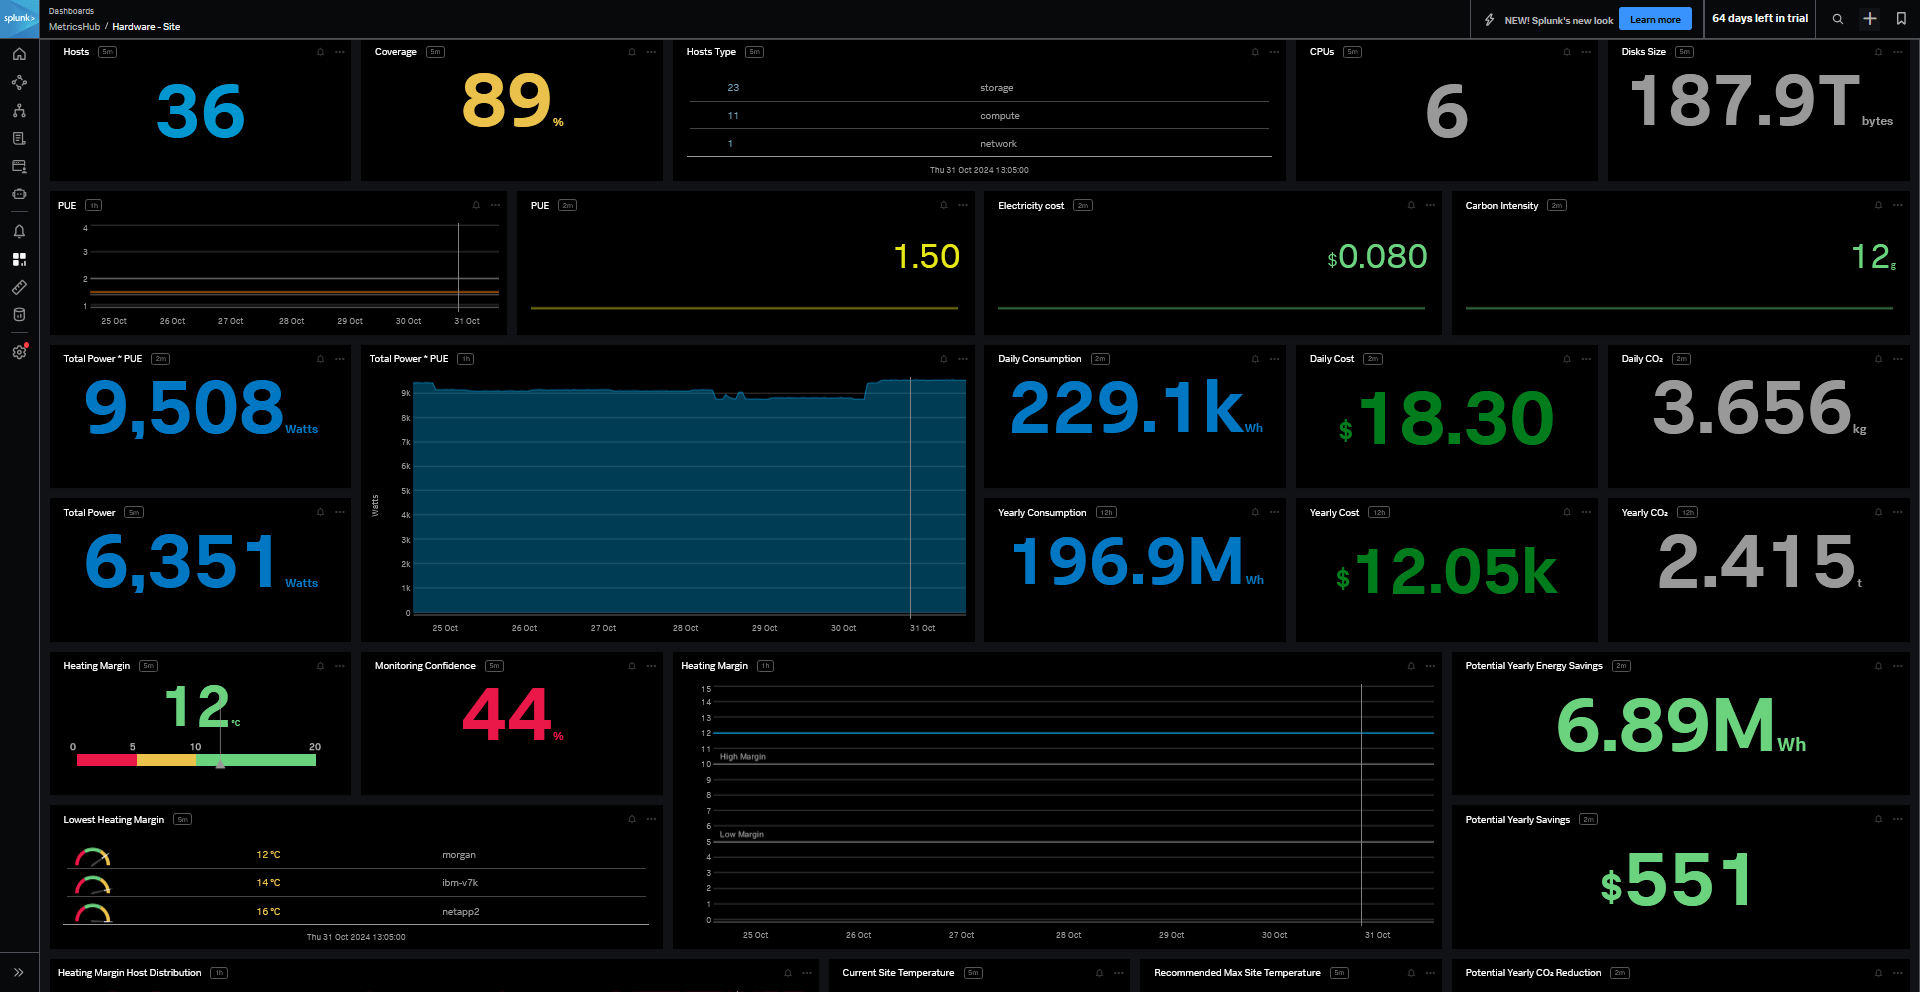
MetricsHub in Action
Collect, unify, and export infrastructure metrics at scale.
How MetricsHub Works
Collect metrics from all your infrastructure — servers, GPUs, PDUs, databases, and more
Collect and transform data at scale — up to 1000 systems per instance
Export to any OpenTelemetry-compatible backend — Grafana, Prometheus, Datadog, and more

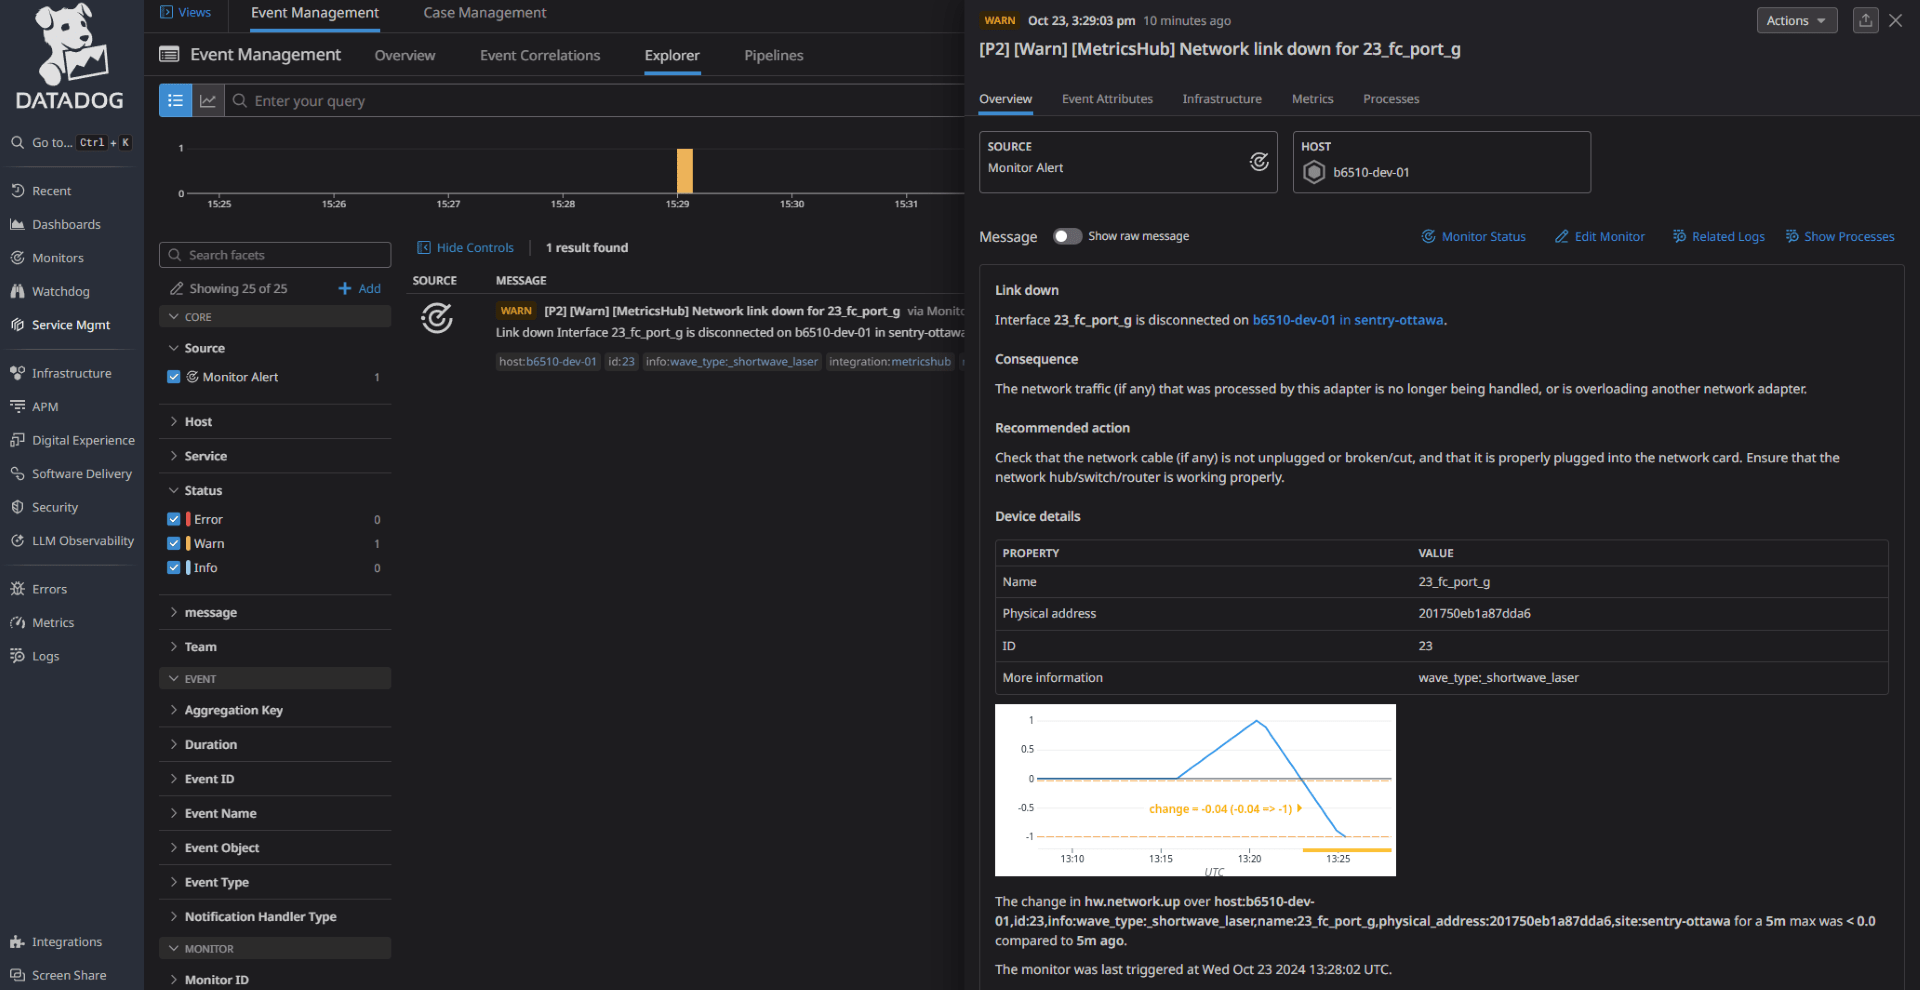
How a Leading Telco Achieved Unified Observability in Just 5 Months
Managing 6,000+ servers across multiple vendors was a challenge—fragmented tools, delayed alerts, and operational inefficiencies put service quality at risk.
MetricsHub changed the game.
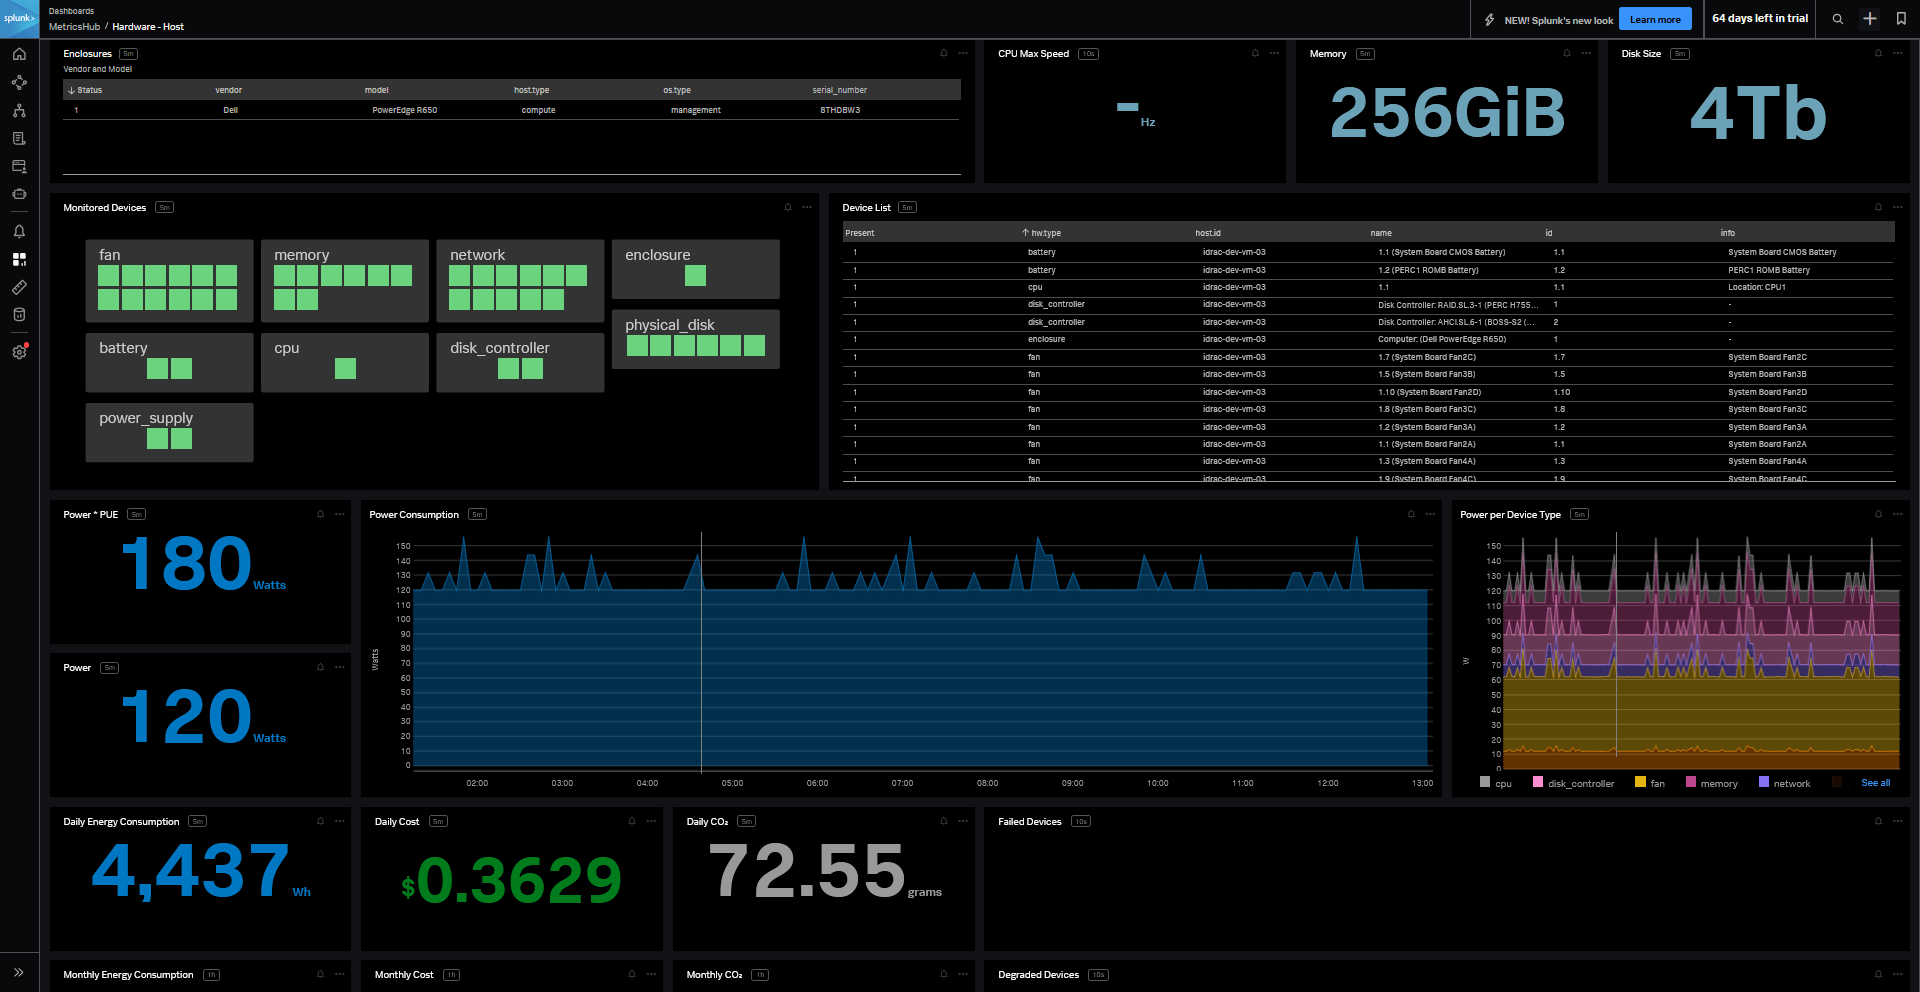
Cover All Your Infrastructure With One Collector
Out-of-the-box support for 100+ platforms — plus custom monitoring via SNMP, SSH, HTTP, WMI, WBEM, IPMI, SQL, and more.
Explore Our Connectors Directory


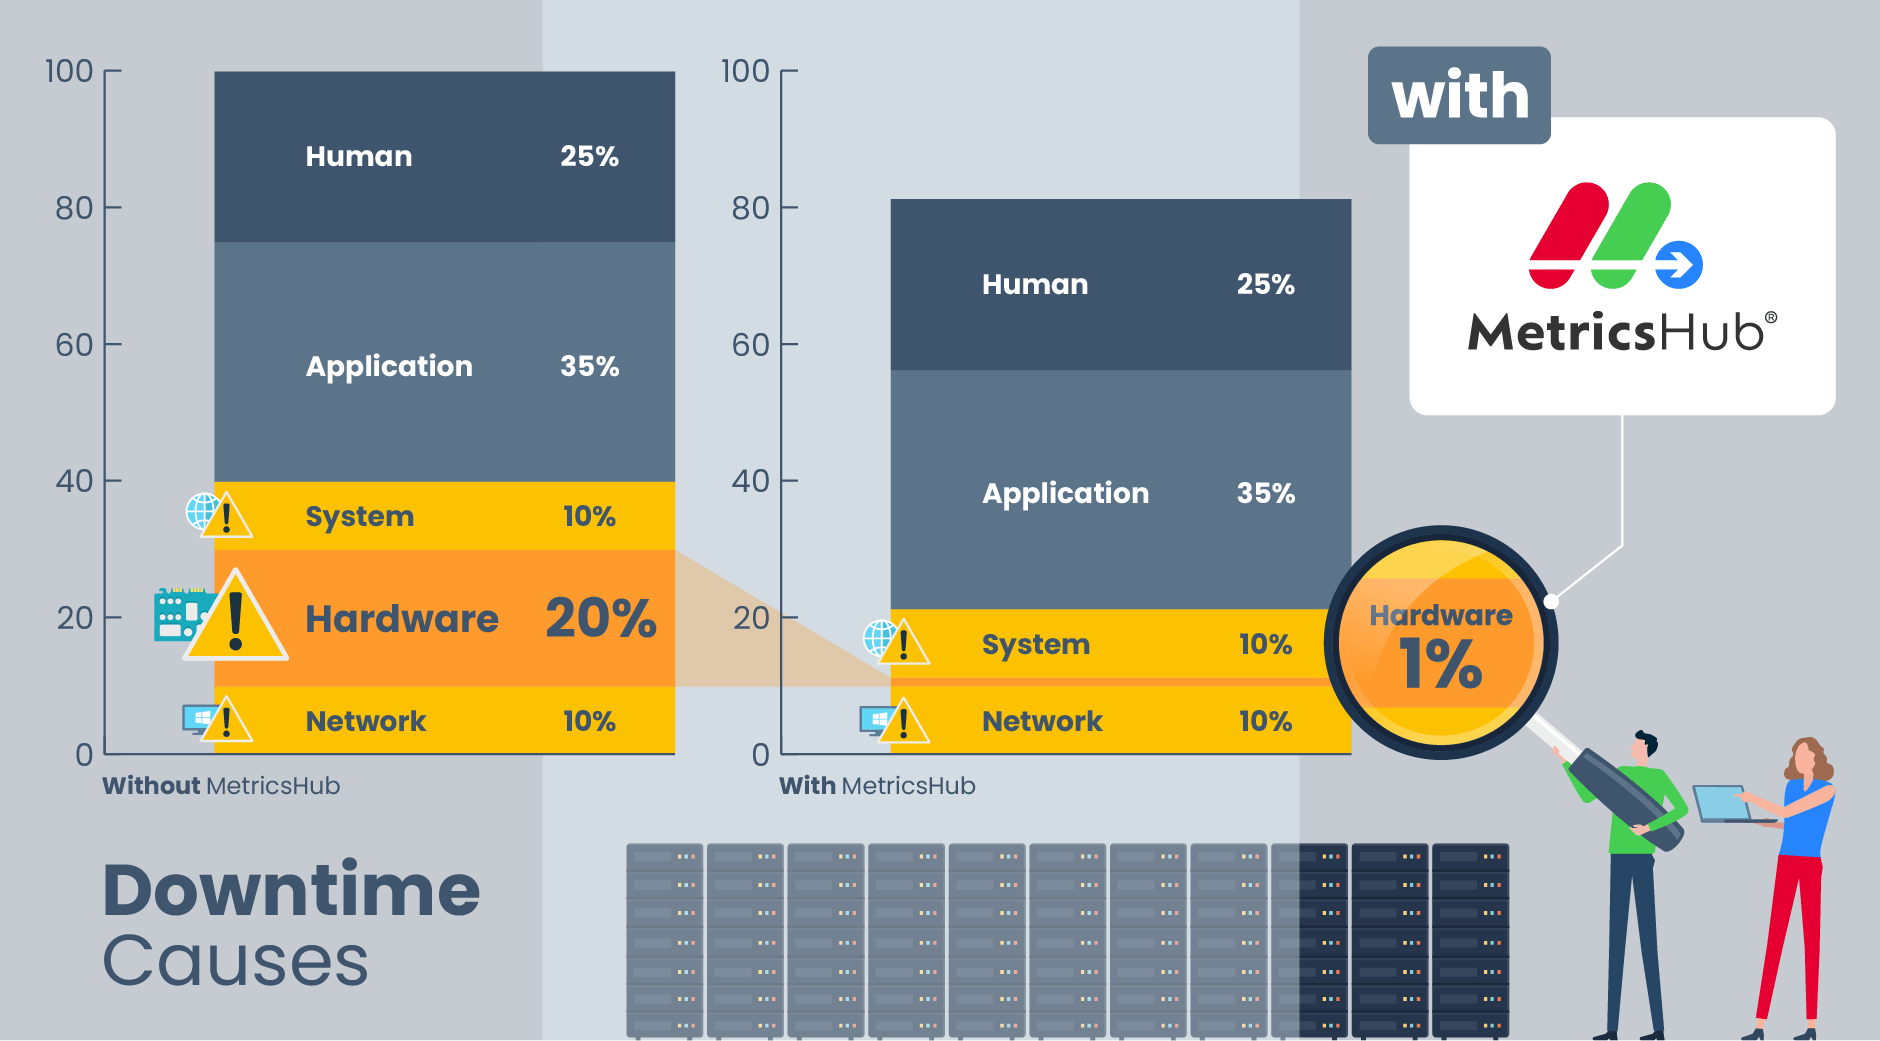
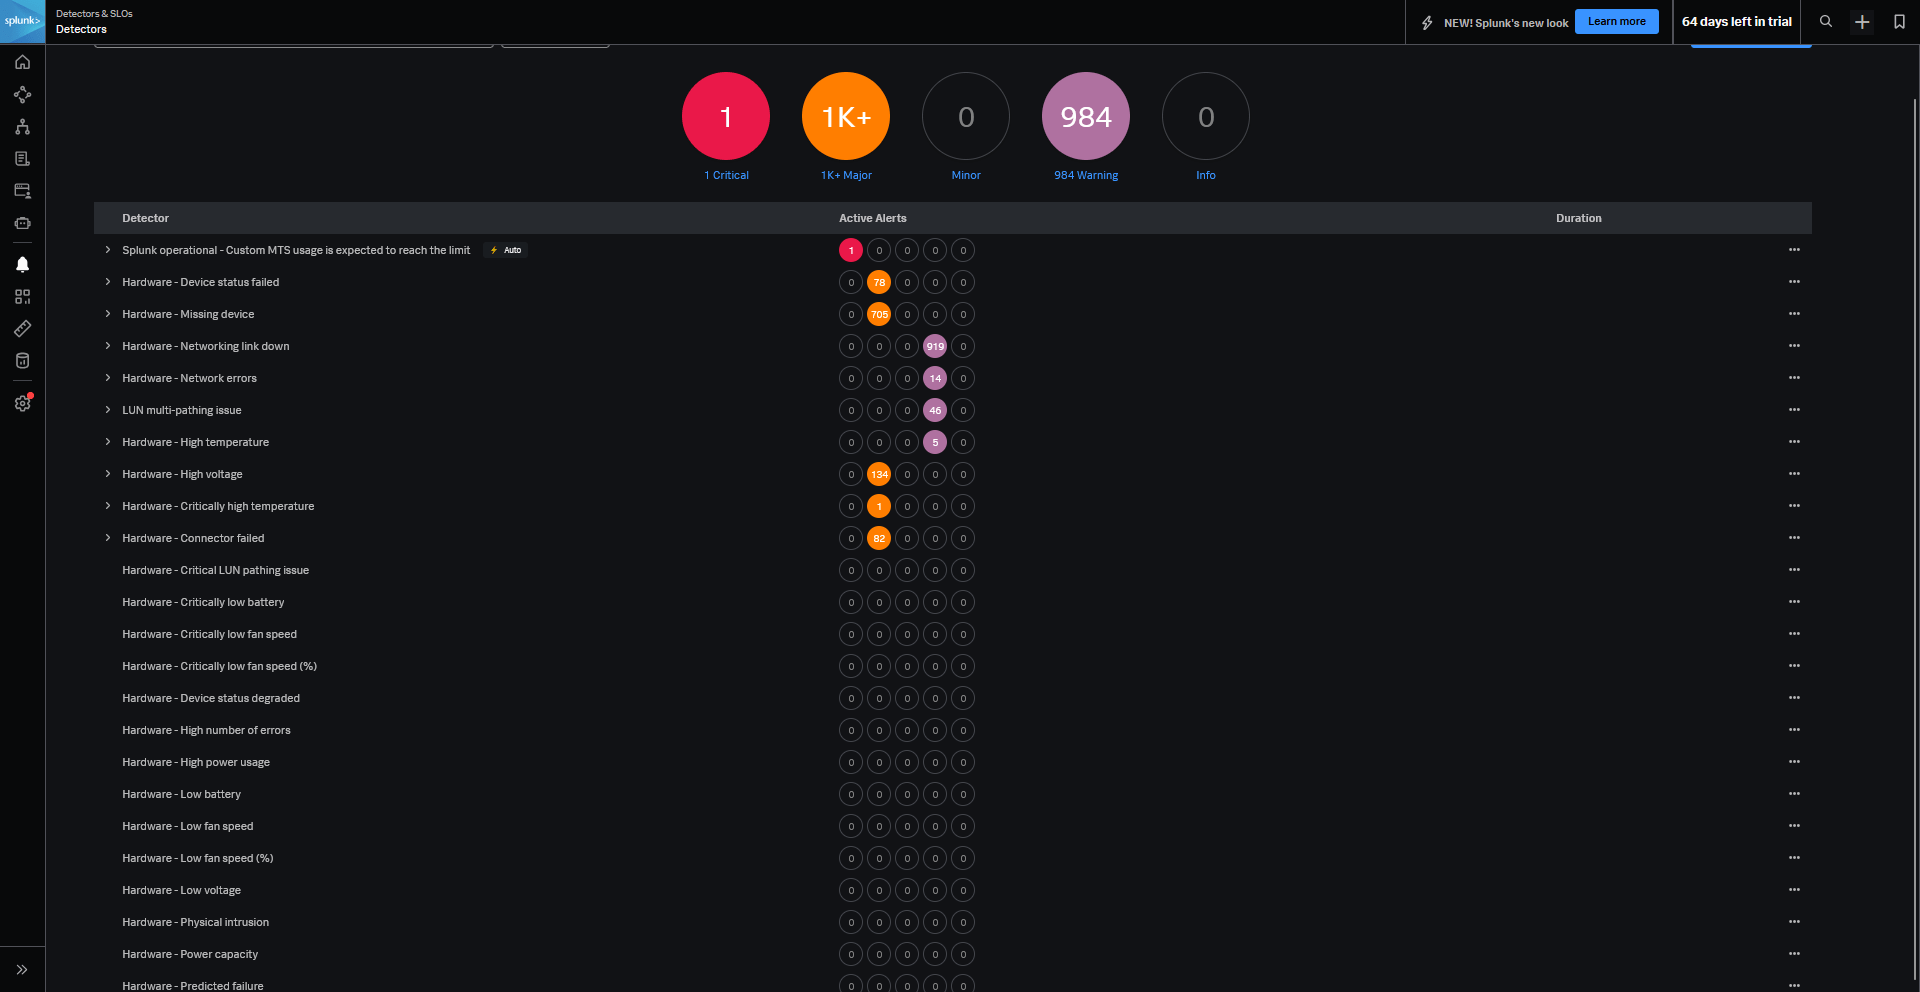
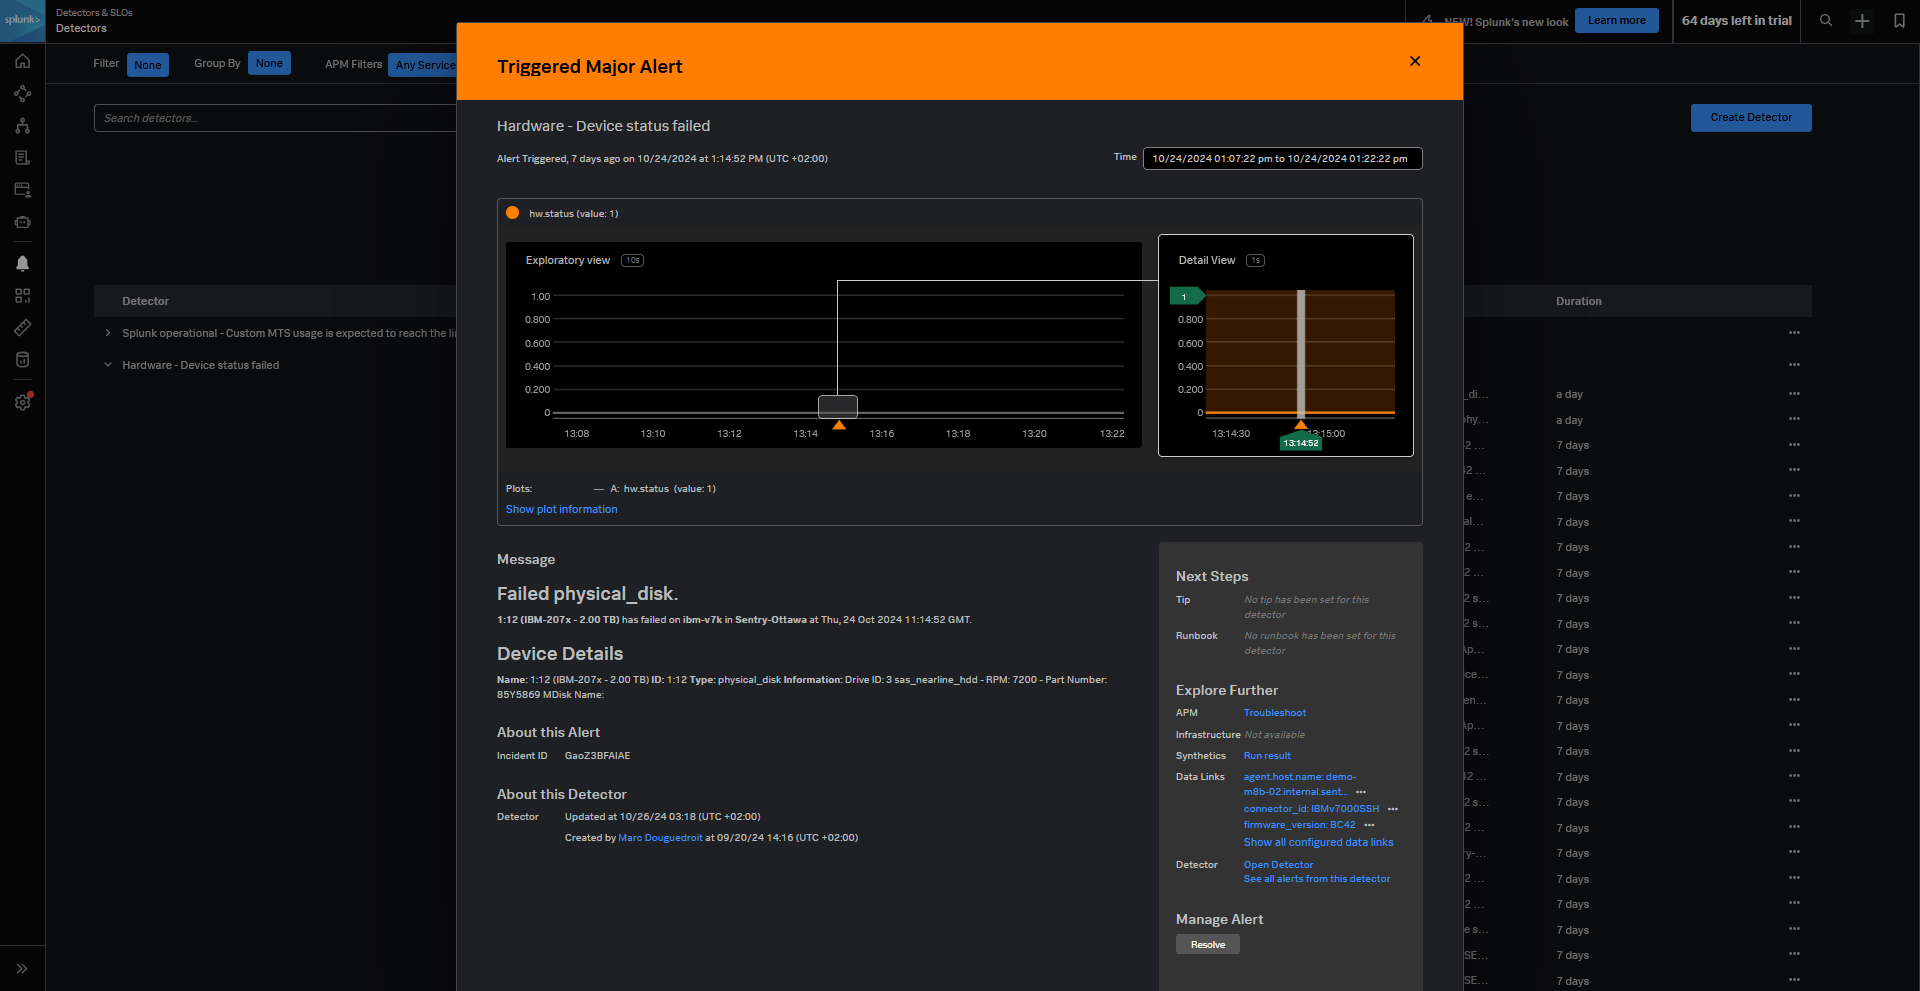
40% of downtime is driven by infrastructure failures
Electronic components have a fixed lifespan—it's not a matter of if they'll fail, but when.
Numbers don't Lie. Take a Look


Connect Your LLM to Real-Time Infrastructure Metrics
- Provide your AI with unified, contextualized metrics from every layer of your infrastructure
- Enable LLMs like ChatGPT or Claude to answer operational questions and assist with diagnostics
- Eliminate manual investigation and speed-up remediation with AI-assisted analysis
- Reduce downtime and business impact with faster, data-driven decisions


Make Your IT Infrastructure Greener: Save Energy, Cut Costs
- Monitor energy usage, electricity costs, and carbon footprint.
- Reduce energy spending through data-driven optimization of data center temperature.
- Ensure compliance with current and future regulations.
Ensure 100% Project Success With MetricsHub Support Desk
- Achieve deployment in complex and large environments safely and quickly
- Rely on a team of certified experts to overcome unpredictable roadblocks
- Get the most out of Prometheus with specialized technical support
- Interact with real people - no chat bot

Harness the Power of Open-Source Collaboration with MetricsHub
- Use the free MetricsHub Community Edition with the Community Connectors for essential hardware and systems monitoring
- Extend observability by developing custom connectors to meet unique needs
- Collaborate with a passionate developer community to enhance your monitoring capabilities
- Shape the future of MetricsHub and make a lasting impact on infrastructure observability


Latest Blog Posts
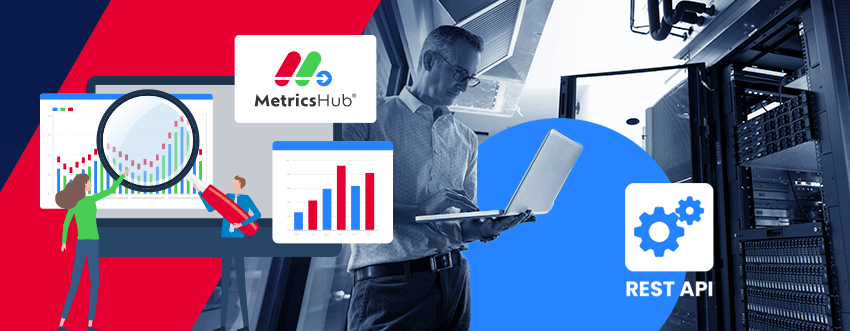
Many modern storage systems, virtualization platforms, and cloud services expose their telemetry through REST APIs rather than traditional monitoring protocols. Discover why REST APIs are becoming essential for infrastructure monitoring.
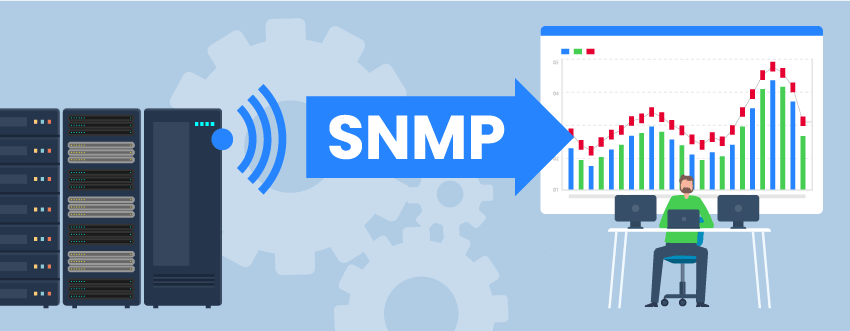
Learn how SNMP works, what devices it can monitor, and how MetricsHub simplifies SNMP data collection for modern observability.

Learn why most system dashboards fail in real-world operations and how our system dashboards for Grafana deliver clear, decision-ready visibility across Windows, Linux, AIX, and HP-UX systems.
Join us on Slack
Engage with our team, ask questions, and provide valuable feedback that shapes the future of our product.
Get invite