

Blog
Why REST APIs Are Becoming Essential for Infrastructure Monitoring
Many modern storage systems, virtualization platforms, and cloud services expose their telemetry through REST APIs rather than traditional monitoring protocols. Learn how MetricsHub leverages REST APIs to collect performance, health, and capacity metrics.

Key Takeaways
- REST APIs have become a primary source of telemetry for modern infrastructure.
- REST APIs provide richer and more structured telemetry than traditional monitoring protocols such as SNMP or IPMI.
- Modern enterprise environments require multiple monitoring protocols to achieve complete infrastructure visibility.
- MetricsHub collects telemetry from REST APIs and traditional protocols, normalizes it with OpenTelemetry, and exports it to your observability platform.
Introduction
REST (Representational State Transfer) is an architectural style for designing distributed systems and web services. REST APIs enable applications and systems to communicate through standard HTTP methods such as GET, POST, PUT, and DELETE.
Today, REST APIs have become the de facto standard for exposing data and services across modern IT environments. While the terms REST API and RESTful API are often used interchangeably, RESTful APIs fully adhere to REST architectural constraints.
For infrastructure monitoring, REST APIs are no longer just management interfaces; they are becoming primary sources of telemetry. As infrastructure vendors increasingly adopt REST APIs to expose operational data, understanding how they work has become essential for modern monitoring and observability.
How Do REST APIs Work?
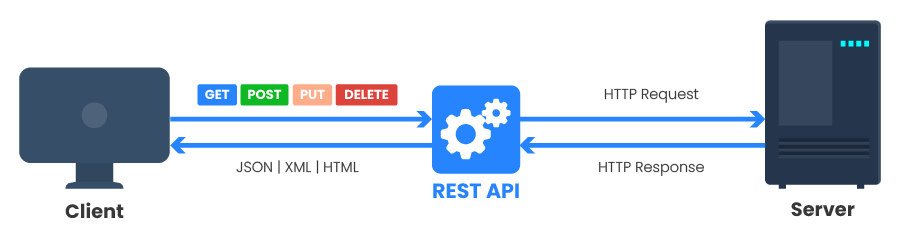
REST APIs enable standardized communication between client applications and servers through HTTP requests and responses.
A client application sends an HTTP request to a server through a REST API to perform a specific operation, such as retrieving data, updating a resource, or deleting an object.
The server processes the request and returns an HTTP response containing:
- A status code indicating whether the operation succeeded (
2xx) or failed (4xxor5xx) - Optional response headers
- A response body, typically formatted as JSON, XML, or HTML
JSON has become the preferred format because it is lightweight, human-readable, and easy for applications to process.
Why Vendors Are Moving to REST APIs
Modern infrastructure platforms generate increasingly complex telemetry that traditional monitoring protocols were not designed to expose.
REST APIs allow vendors to provide:
- Richer data models containing detailed performance, health, and configuration information
- Structured JSON responses that are easier for applications to process than MIBs and OIDs
- Modern authentication and authorization mechanisms
- Faster API evolution without protocol limitations
- Better alignment with cloud-native and web-based architectures
As a result, vendors such as Dell, NetApp, Pure Storage, NVIDIA, HPE, and Proxmox increasingly expose operational data through REST APIs.
This evolution is already visible across major infrastructure vendors. While traditional monitoring interfaces remain supported, vendors increasingly invest in REST APIs as their primary telemetry and management interface.
| Vendor | Traditional Monitoring Interface | Modern Interface |
|---|---|---|
| Dell PowerScale (formerly Isilon) | SSH | REST |
| NetApp ONTAP | SNMP | REST |
| Pure Storage | SSH | REST |
REST APIs vs SNMP
REST APIs are not replacing SNMP entirely. Rather, the two technologies complement one another. While SNMP remains highly efficient for polling network devices, REST APIs provide richer and more structured telemetry from modern infrastructure platforms.
The following comparison highlights their respective strengths:
| Feature | REST APIs | SNMP |
|---|---|---|
| Data Format | JSON, XML | OIDs |
| Ease of Use | Easy to query, harder to operationalize at scale | Efficient for polling, but requires MIB/OID expertise |
| Data Richness | Very High | Moderate |
| Resource Consumption | Higher | Lower |
| Security | Modern authentication (tokens, sessions, OAuth, etc.) | SNMPv1/v2c are weak; SNMPv3 provides stronger security but is more complex to configure |
| Network Equipment | Good | Excellent |
| Storage Systems | Excellent | Good |
| Modern Platforms | Excellent | Limited |
To illustrate the differences between REST APIs and SNMP, let’s compare the capabilities of the three MetricsHub NetApp connectors: NetApp Filer (SNMP), NetApp Filer (REST), and NetApp Filer REST v2.
| Capability | SNMP | REST | REST v2 |
|---|---|---|---|
| Hardware Health | |||
| Fans & Power Supplies | |||
| Disk Monitoring | |||
| Aggregates | Limited | ||
| LUN Monitoring | Limited |
This example illustrates why many vendors are investing in REST APIs. While SNMP remains valuable for hardware and environmental monitoring, REST APIs often expose deeper inventory, configuration, and storage-specific telemetry.
Why REST Monitoring is More Complex Than It Looks
While REST APIs provide richer telemetry, they also introduce new monitoring challenges.
Unlike SNMP, where most information can be retrieved through a relatively consistent polling mechanism, each REST API implementation is unique. Endpoints, authentication methods, data models, pagination, and response formats vary significantly from one manufacturer to another.
| Vendor | Typical Authentication Method |
|---|---|
| NetApp | Credentials or API Token |
| Huawei | Session |
| Proxmox | Ticket + CSRF Token |
| Redfish | Session or Basic Authentication |
| Pure Storage | API Token |
A monitoring solution typically needs to:
- Authenticate with a login endpoint
- Retrieve and refresh session tokens or API tokens
- Discover available resources
- Query inventory endpoints
- Query performance and health endpoints
- Handle pagination and multiple API versions
- Extract metrics from JSON responses
- Normalize vendor-specific data
- Export standardized telemetry
Collecting telemetry through REST APIs therefore involves much more than sending a simple HTTP request.
How Does MetricsHub Leverage REST APIs?
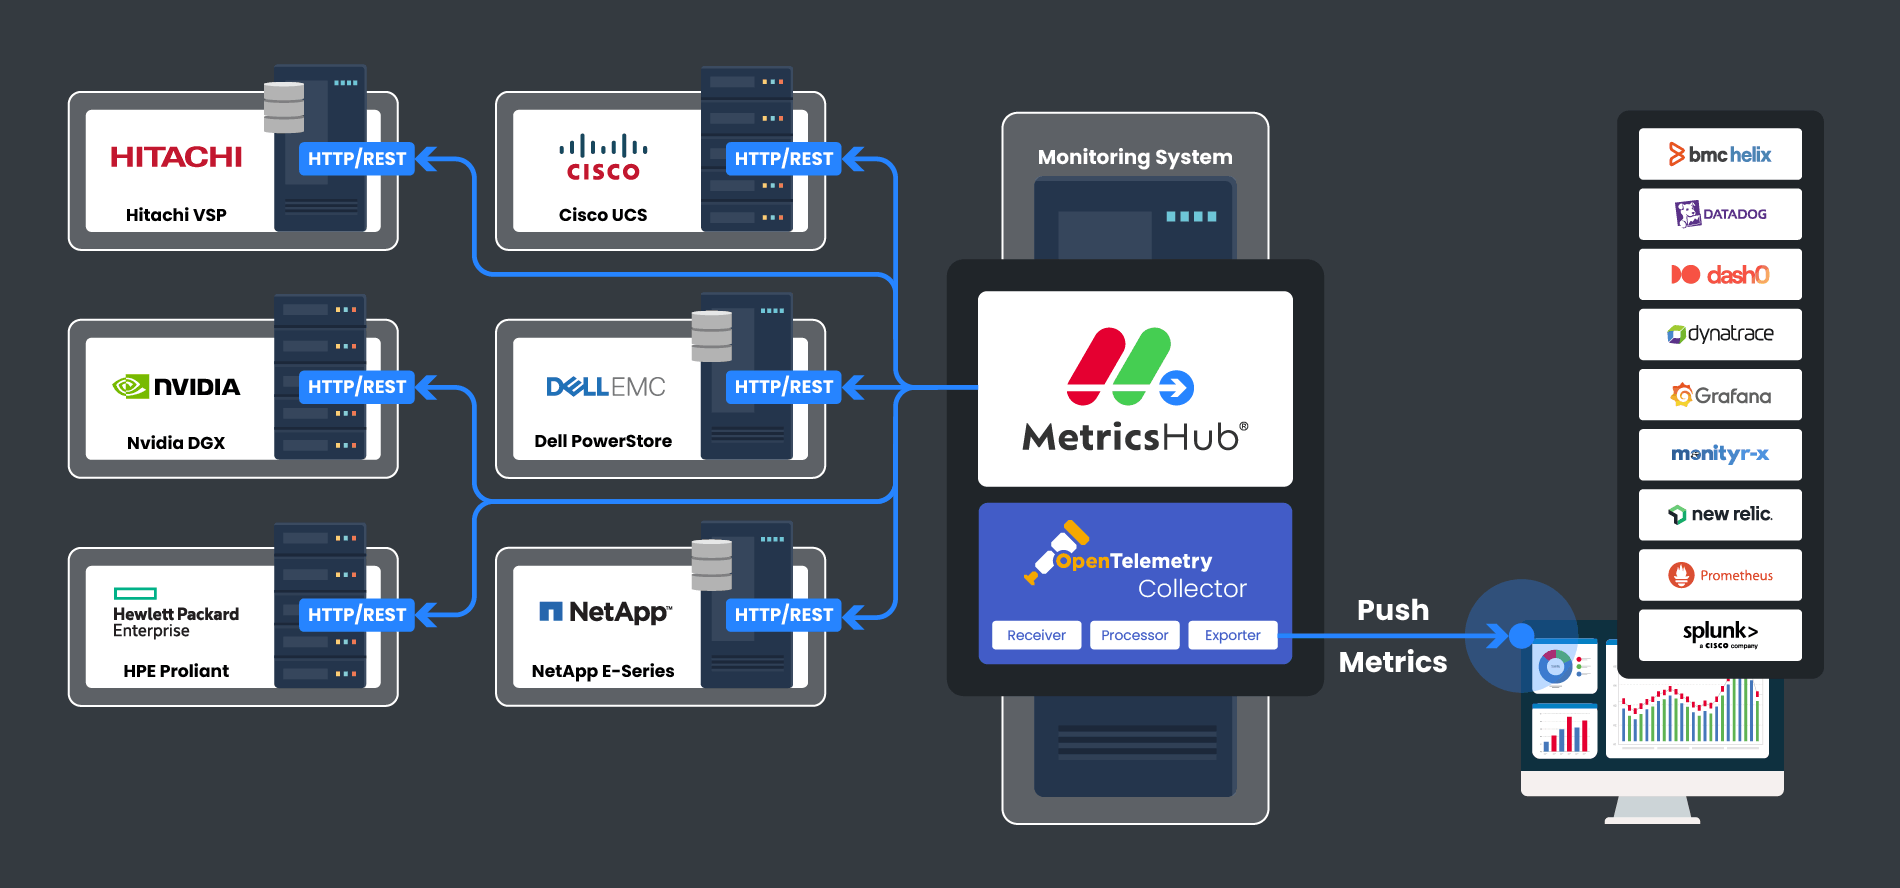
MetricsHub relies on REST APIs to collect performance, capacity, health, and configuration data from a wide variety of infrastructure devices and platforms, including storage systems, virtualization platforms, server management interfaces, and AI infrastructure.
During the discovery phase, MetricsHub sends HTTP requests to identify the target system and determine which connector should be activated. By analyzing the HTTP response, MetricsHub can automatically recognize supported technologies and apply the appropriate monitoring logic.
Connector activation typically follows one of two approaches:
- For a simple GET request: The relevant connector is activated when an HTTP
200status code is returned or the response body contains a predefined regular expression. - For a GET request with headers: MetricsHub sends the required headers and evaluates the response body against expected patterns before activating the relevant connector.
For example, when discovering a NetApp storage system, MetricsHub identifies the platform and ONTAP version, automatically selects the appropriate REST connector, and begins collecting health, capacity, and performance metrics.
Simplifying REST-Based Monitoring with MetricsHub
Most monitoring platforms can send requests to REST endpoints. The real challenge lies in understanding hundreds of vendor-specific APIs, authentication methods, endpoint structures, and data models.
Instead of writing and maintaining custom scripts for every vendor API, MetricsHub provides a library of production-ready connectors that already understand vendor-specific authentication flows, discovery mechanisms, endpoint structures, and telemetry semantics.
By interacting directly with vendor APIs, MetricsHub can retrieve detailed telemetry that may not be available through traditional monitoring protocols such as SNMP. This approach enables deeper visibility into modern storage systems, servers, virtualization platforms, and AI infrastructure.
A single REST API response can expose dozens of performance and health metrics. For example, a storage controller might expose the following metrics through a REST API:
{
  "name": "Controller-A",
  "cpu_usage": 73,
  "read_iops": 15234,
  "write_iops": 8123,
  "latency_ms": 1.7
}
MetricsHub automatically extracts these values, normalizes them, and transforms them into standardized OpenTelemetry metrics.
This enables observability platforms such as Grafana, Datadog, Cisco Splunk, and BMC Helix to consume telemetry from different technologies through a consistent data model.
Conclusion
As infrastructure vendors continue to expand their REST APIs, monitoring platforms must be able to collect and standardize increasingly diverse telemetry sources.
While REST APIs provide access to richer operational data, they also introduce challenges related to authentication, discovery, endpoint navigation, API evolution, and data normalization.
MetricsHub addresses these challenges through its extensive connector library, automated discovery capabilities, and OpenTelemetry-native architecture. By abstracting vendor-specific implementations, MetricsHub enables organizations to take advantage of REST-based monitoring without having to master every API individually.
Explore the MetricsHub connector library to discover how REST-based integrations can extend visibility across storage, servers, virtualization, and AI infrastructure—without custom API scripting.
What to Remember
REST APIs are becoming the preferred way to expose infrastructure telemetry, but they don't replace traditional monitoring protocols. The most effective monitoring strategy combines REST APIs with protocols such as SNMP, WMI, WBEM, and IPMI to deliver complete infrastructure visibility. MetricsHub simplifies this approach by collecting and normalizing telemetry from all these protocols.