Data Center Monitoring
MetricsHub collects all critical metrics in your data center from power infrastructure to environmental sensors, including IT: servers, storage systems, and network devices.
It enables your organization to calculate efficiency and sustainability indicators such as PUE, WUE, CUE, and ITUE, within your preferred observability platform.

Managing Energy and Thermal Constraints in Modern Data Centers
The rapid growth of AI and high-density computing is significantly increasing power consumption and thermal constraints in data centers. Operators must balance capacity expansion with energy efficiency, sustainability goals, and infrastructure reliability while maintaining service continuity.
Where MetricsHub Fits in the DCIM Landscape
Data center monitoring involves multiple categories of tools, each addressing different operational needs. The table below highlights how MetricsHub complements DCIM and traditional infrastructure monitoring solutions.
| Feature | DCIM Tools | Infrastructure Monitoring Tools (Zabbix, SolarWinds, etc.) |
Observability Platforms + MetricsHub |
|---|---|---|---|
| Server & Hardware Monitoring | |||
| Network Device Monitoring | |||
| PDU & UPS Monitoring | |||
| Environmental Monitoring (Temperature, Humidity) | |||
| PUE & WUE | |||
| CUE, Carbon Footprint & Sustainability Metrics | |||
| ITUE | |||
| Physical Asset Management | |||
| Rack & Floor Modeling (Digital Twin) | |||
| Facility Workflow & Capacity Planning | |||
| Dashboarding & Visualization | |||
| Openness & Interoperability Proprietary Varies | Proprietary | Varies |
Supported Limited Not supported
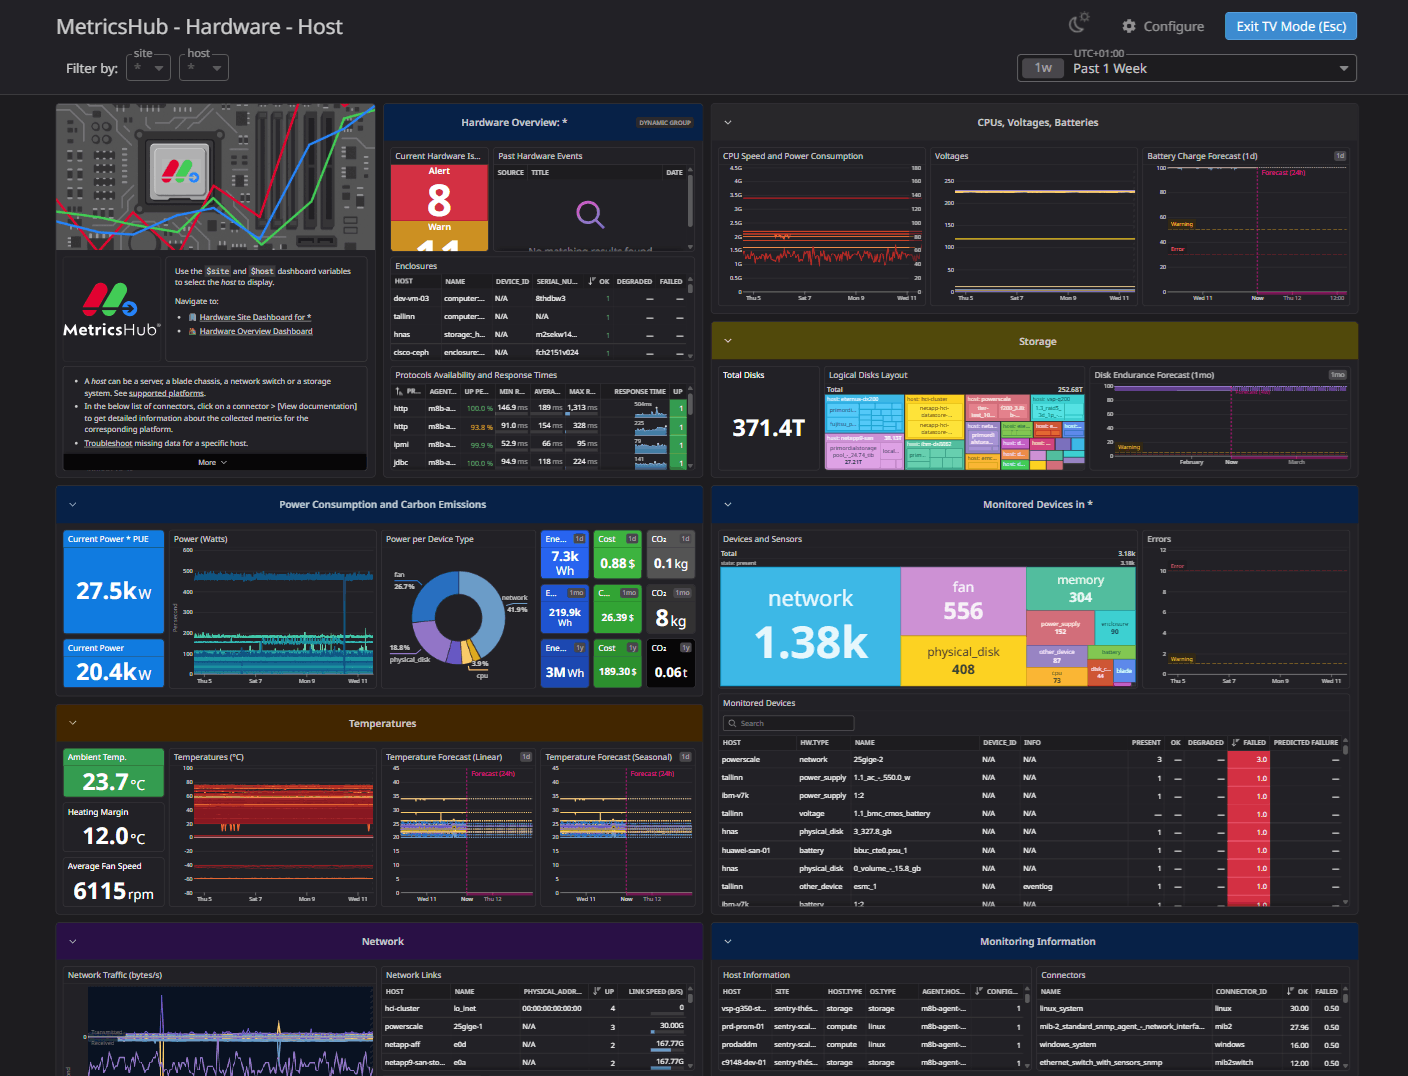
How MetricsHub Provides Data Center Monitoring
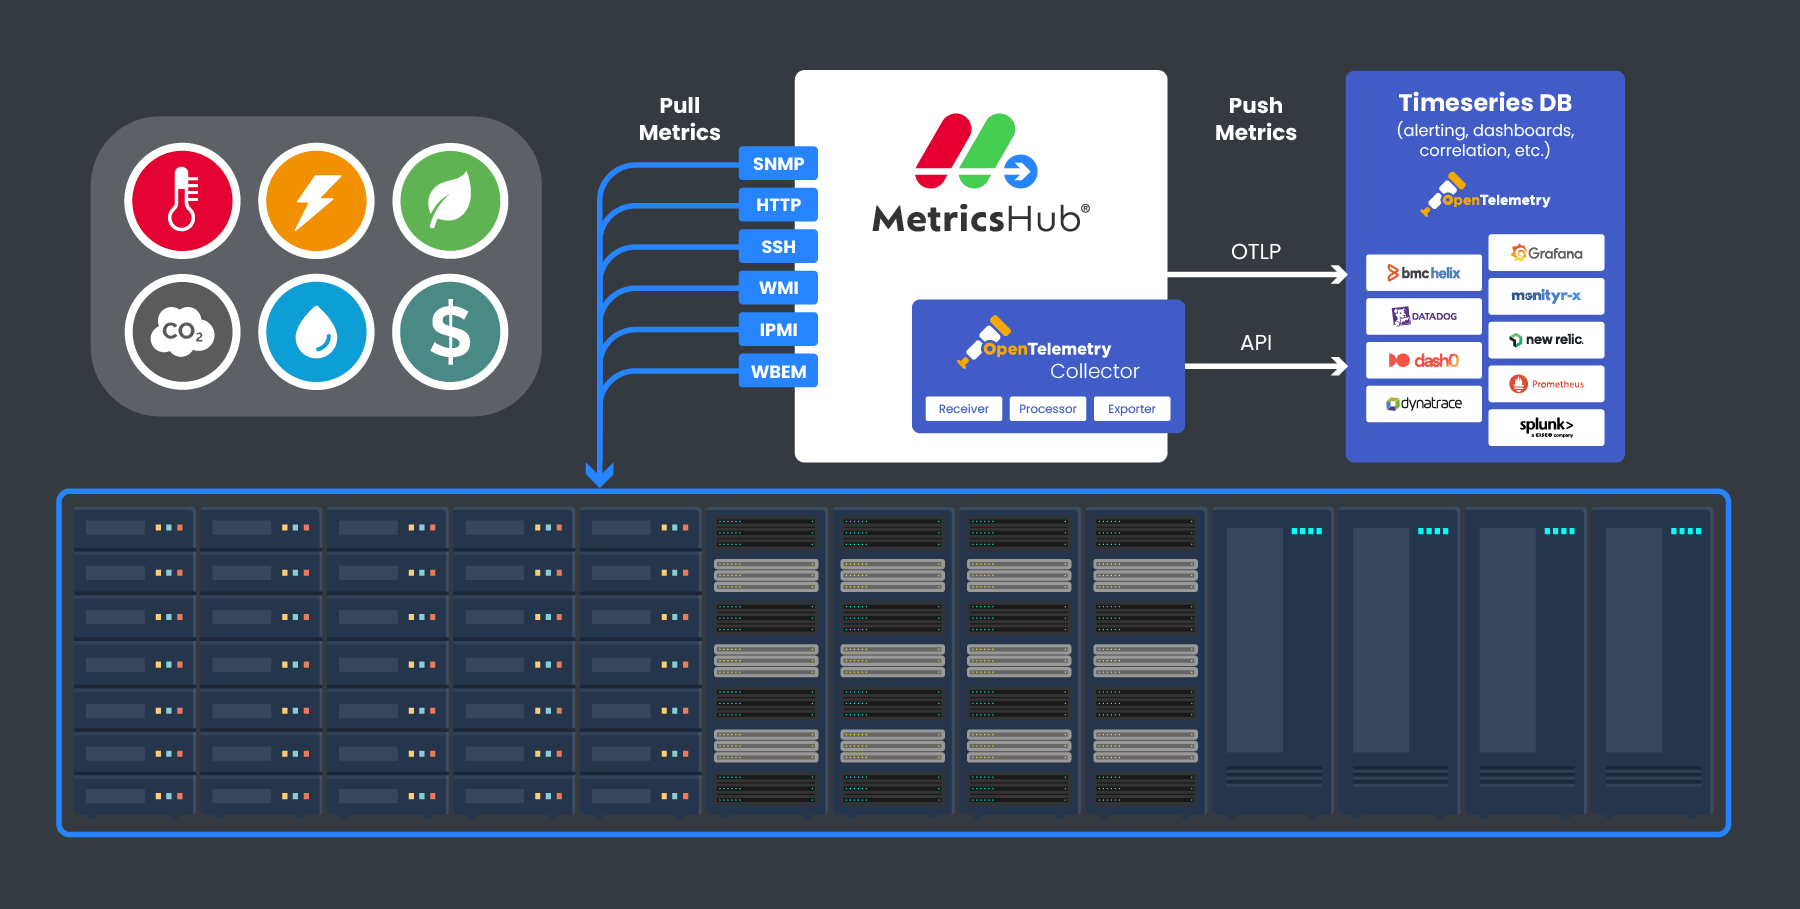
MetricsHub is a robust collection agent deployed within your infrastructure that gathers power, energy, voltage, battery, and temperature metrics from servers, PDUs, UPS, etc., using multiple standard protocols.
It normalizes and enriches the collected metrics and exports them in OpenTelemetry format to your preferred observability platform (BMC Helix, Datadog, Grafana, etc.), enabling centralized dashboards, alerting, and correlation.
Monitor Power Infrastructure (PDU & UPS)
MetricsHub collects real-time metrics from APC, Eaton, Raritan, and Schneider Electric PDUs and UPS systems via SNMP.
- Monitor real-time power consumption and cumulative energy usage for PDUs and UPS units.
- Track UPS battery charge and estimated remaining runtime.
- Monitor hardware status indicators, including degraded and failed states.
- Monitor PDU load and voltage metrics with associated threshold limits.
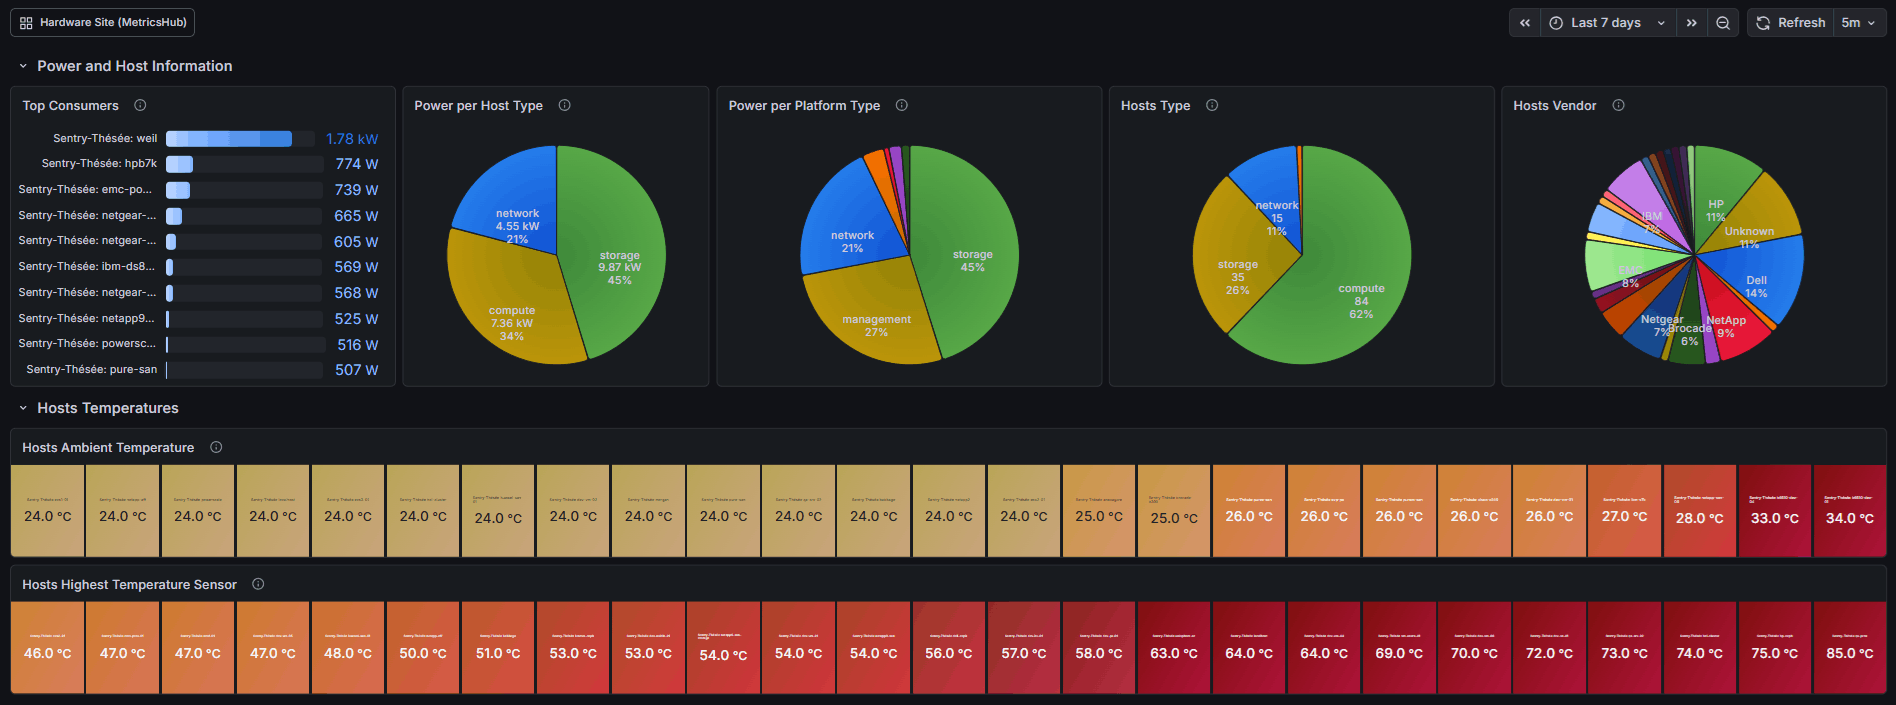
Optimize Cooling & Environmental Conditions
MetricsHub provides real-time temperature visibility inside servers and network devices to support informed cooling decisions.
- Monitor temperature sensors inside servers and network devices
- Receive alerts when systems approach critical temperature thresholds
- Assess the heating margin of each server and network device to guide safe ambient temperature adjustments
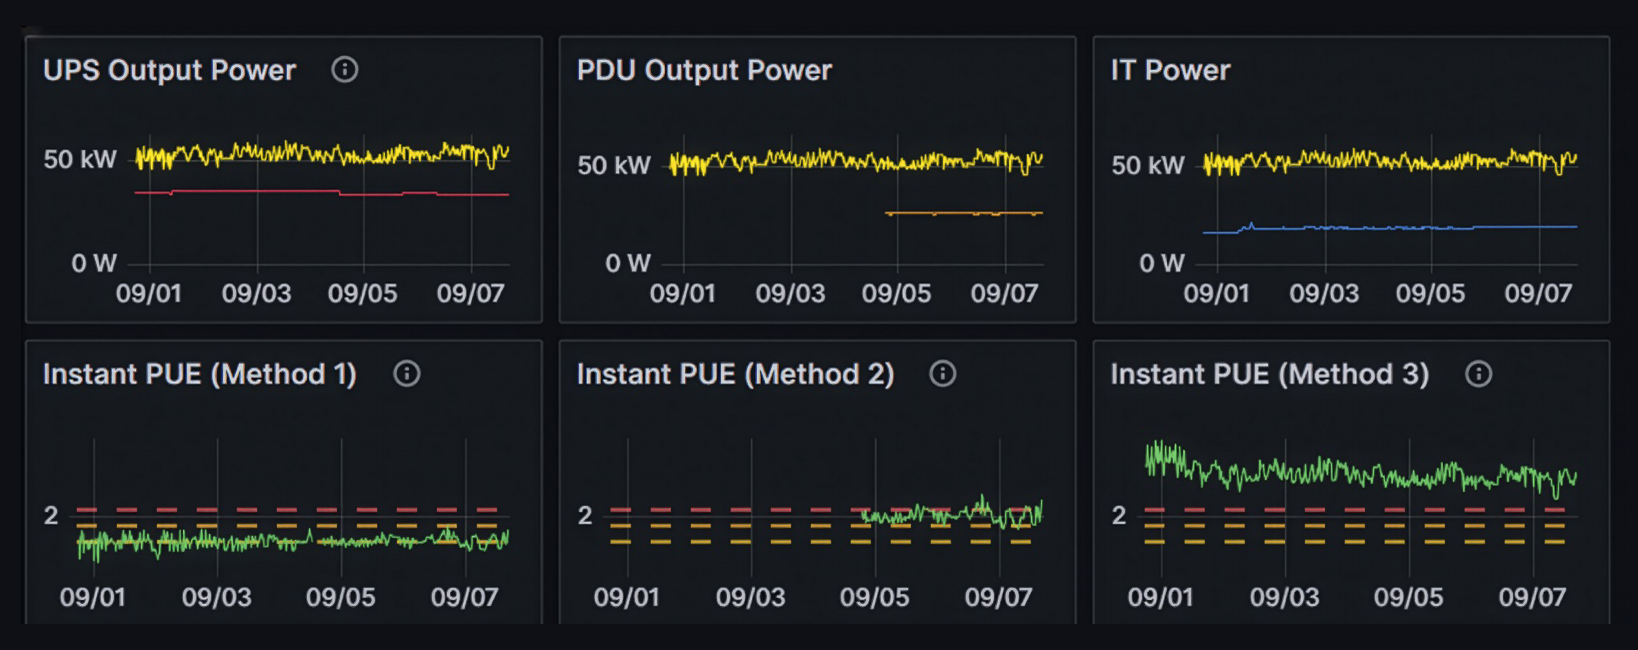
Assess Data Center Efficiency (PUE, WUE, CUE, and ITUE)
MetricsHub collects the data required to assess key efficiency indicators such as PUE, WUE, CUE, and ITUE:
- Total data center energy consumption
- UPS and/or PDU output energy
- Server input (IT load)
- Electricity price
- Carbon intensity
- Water usage counters
Need assistance in assessing your data center efficiency? Contact our Professional Services team.
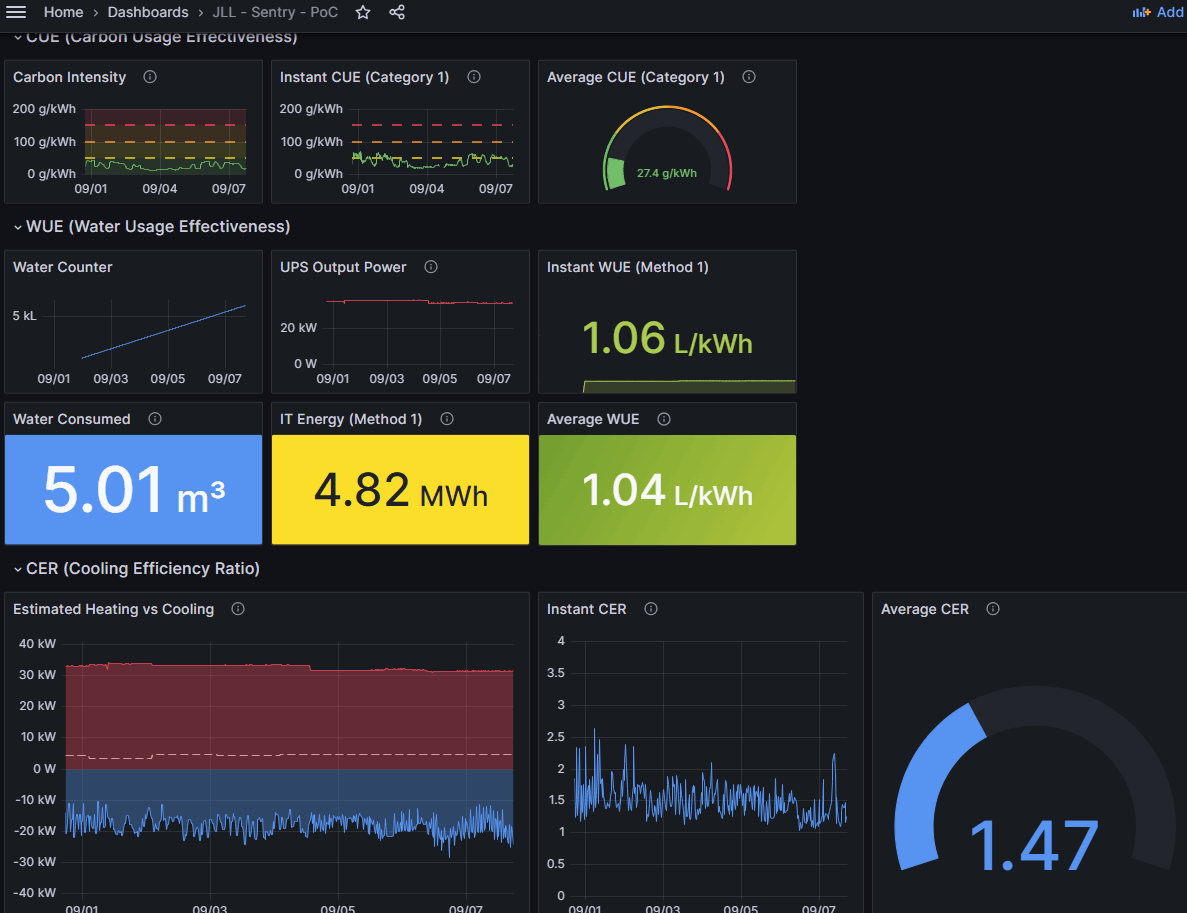
Estimate and Track Carbon Emissions
MetricsHub provides visibility into the carbon footprint of your IT infrastructure through pre-built dashboards:
- Estimate IT energy usage through a software-based approach (no PDUs required for server-level estimation)
- Assess electricity costs based on real-time energy prices
- Derive CO₂ emissions by combining energy consumption with real-time carbon intensity
- Analyze carbon emissions per server, per site, across the entire infrastructure, and by business service or application
- Track historical trends to evaluate the effectiveness of sustainability initiatives
Bring Data Center Monitoring to Your Observability Platform
MetricsHub provides visibility into the carbon footprint of your IT infrastructure through pre-built dashboards:
- Expose the collected metrics into your preferred observability platform through the embedded OpenTelemetry Collector
- Understand the health of your IT infrastructure at a glance with our prebuilt dashboards
- Receive alerts through your existing alerting systems, including Prometheus Alertmanager, Datadog Monitors, and others
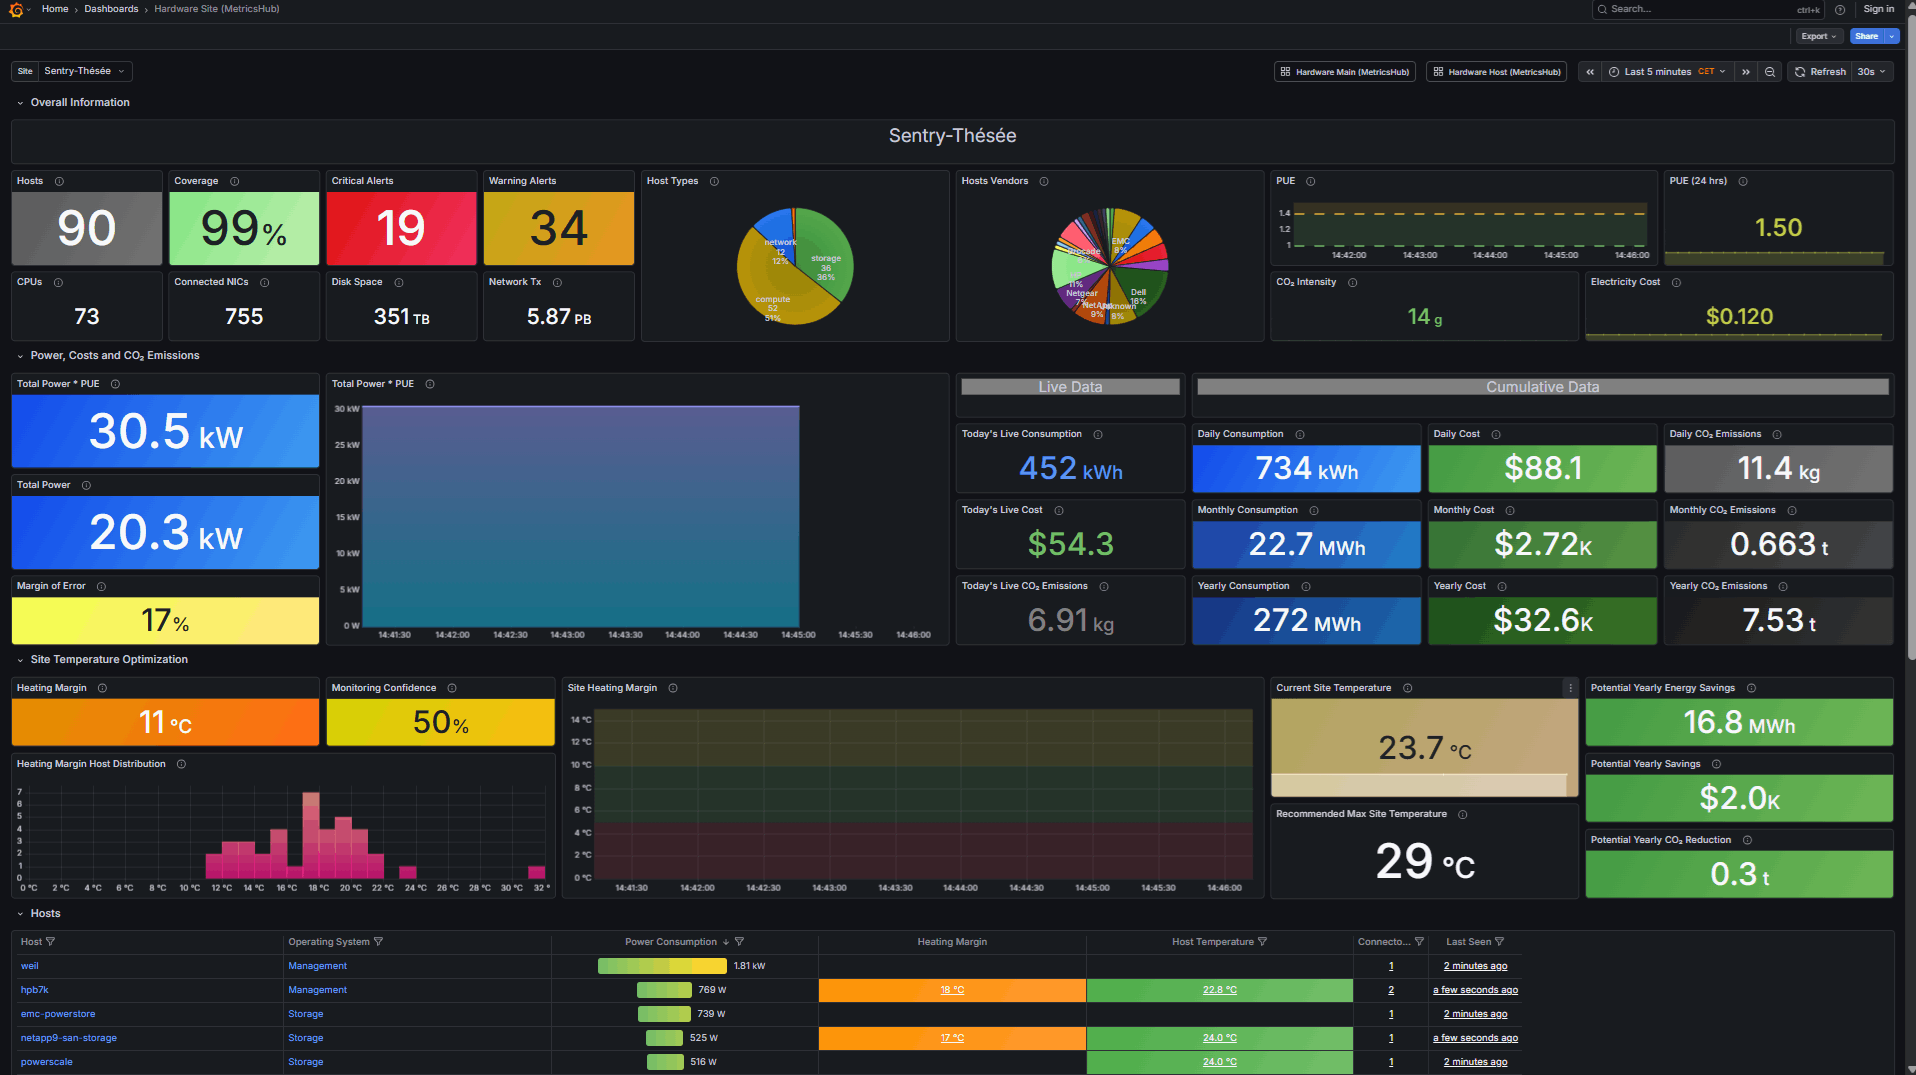
Real-World Example
Cutting Data Center Cooling Energy by 15% Through Temperature Optimization

To support its goal of reducing scope 1 and 2 greenhouse gas emissions, our company focused on optimizing cooling in its on-premises data center, one of its main sources of electricity consumption.
The team implemented MetricsHub Enterprise to collect hardware health and sustainability metrics and used the Hardware (MetricsHub) Grafana dashboards to determine optimal temperature increases without compromising infrastructure reliability.
This resulted in a 15% reduction in electricity consumption for cooling and a 7% decrease in carbon emissions.
Read the Full StoryAdditional Resources
From the Lab
FAQ

- PUE (Power Usage Effectiveness): Measures overall energy efficiency by comparing total facility energy to IT equipment energy.
(PUE = Total Facility Energy ÷ IT Energy) - CUE (Carbon Usage Effectiveness): Assesses the carbon impact of a data center by relating total CO₂ emissions to IT energy consumption.
(CUE = Total CO₂ Emissions ÷ IT Energy) - WUE (Water Usage Effectiveness): Evaluates the amount of water used for cooling relative to IT energy consumption.
(WUE = Annual Water Usage ÷ IT Energy) - ITUE (IT Equipment Usage Effectiveness): Indicates the proportion of total facility energy consumed by the computing activities, providing a complementary perspective to PUE.
(ITUE = Total Facility Energy ÷ Energy Consumed by the Computing Activities)
You Need MetricsHub if You:
Reduce the risk of downtime caused by hardware failures (power supplies, batteries, UPS, PDUs)
Report on the power consumption and carbon emissions of your IT infrastructure
Assess the PUE, WUE, CUE, and ITUE of your data center
Reduce your energy bill and carbon footprint through data center temperature optimization