Blog
SNMP Monitoring Explained: From Devices to Observability Platforms
Learn how SNMP works, what devices it can monitor, and how MetricsHub simplifies SNMP data collection for modern observability.
Key Takeaways
- SNMP remains one of the most widely used protocols for monitoring network and infrastructure devices.
- SNMP monitoring relies on polling and, in some environments, traps to collect health and performance metrics from devices.
- While powerful and widely supported, SNMP can be complex to configure and interpret because of OIDs, MIBs, and protocol versions.
- MetricsHub simplifies SNMP monitoring by collecting, normalizing, and exporting SNMP telemetry as OpenTelemetry metrics.
Table of Contents
SNMP, the backbone of monitoring
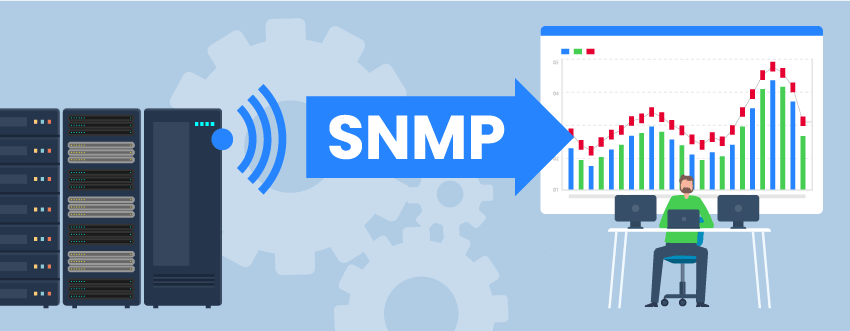
The Simple Network Management Protocol (SNMP) has been a cornerstone of infrastructure monitoring since its introduction in 1988. Designed to enable remote monitoring and management of IP-connected devices, it quickly became a standard across the industry.
Today, SNMP is supported by a wide range of equipment, making it one of the most universal protocols in IT environments. Despite the rise of modern observability tools, SNMP remains widely used because it is embedded in virtually all network and infrastructure devices and provides a reliable way to access low-level metrics across heterogeneous environments.
What devices can be monitored with SNMP?
Typically, any device that exposes an SNMP agent — whether built in or installed — can be monitored using SNMP. This includes routers, switches, servers, printers, storage systems, UPSs, PDUs, and out-of-band management controllers.
MetricsHub supports a very broad range of SNMP-enabled devices, spanning:
-
Network equipment (switches, routers, firewalls) such as Cisco Ethernet Switches, Arista BGP Switches, Aruba devices, F5 BigIP


-
Servers and chassis management systems, such as Dell iDRAC, HPE ProLiant, Cisco UCS, Fujitsu PRIMERGY


-
Storage arrays and SAN infrastructure, such as NetApp systems, Dell EqualLogic, EMC Isilon, Brocade SAN switches


-
Power and environmental devices, such as APC UPS, APC PDU, Eaton PDU


For the complete and up-to-date list of supported platforms, see the MetricsHub connectors directory.
How does SNMP work?
SNMP operates through two main components:
-
The SNMP Agent

Traditional SNMP Monitoring
When enabled, the agent collects metrics about its status (CPU, memory, hardware health, etc.) and makes this data available when requested.
-
The SNMP Manager
This is the system responsible for querying agents, collecting their data, and presenting it through dashboards or other visualization tools.
In traditional setups, the SNMP manager plays a central role in both data collection and analysis.
With MetricsHub, SNMP monitoring does not have to rely on a traditional, all-in-one SNMP network management system.
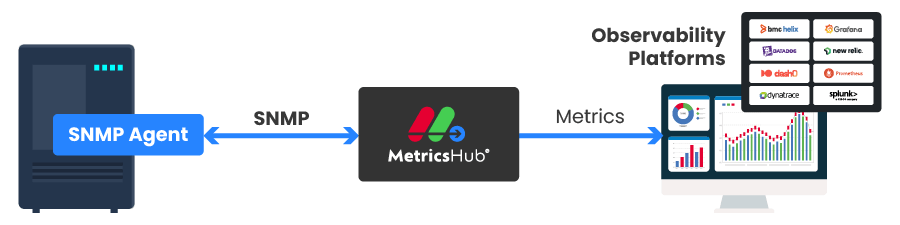
MetricsHub-Based Monitoring
MetricsHub acts as the SNMP collector by querying SNMP agents directly, normalizing the collected data, and forwarding the resulting metrics to modern observability platforms through OpenTelemetry.
How is SNMP data collected?
There are two ways of collecting data:
SNMP Polling
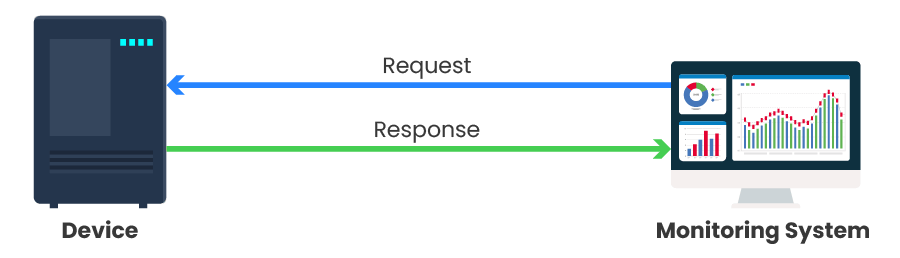
SNMP Polling
The monitoring system regularly queries devices to retrieve metrics. This approach provides consistent and continuous visibility into the state of your infrastructure.
SNMP Traps
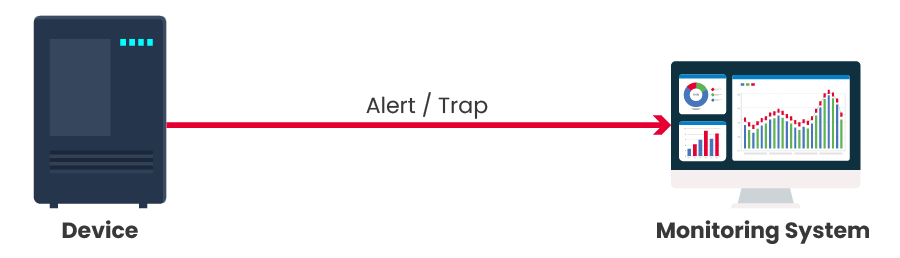
SNMP Traps
Devices proactively send alerts when specific events occur, such as failures or threshold breaches. This enables faster detection of critical issues.
In practice, these two approaches complement each other: polling ensures continuous monitoring, while traps provide real-time event notifications.
At the time of writing this post, MetricsHub supports SNMP polling, not SNMP traps.
Understanding SNMP Versions: v1, v2c, and v3
SNMP has evolved over time, and three main versions are still encountered in modern environments: v1, v2c, and v3.
- SNMPv1: The original version of SNMP. It is simple but limited in functionality and security. Today, it is mostly considered legacy and rarely used in new deployments.
- SNMPv2c: An improved version that offers better performance and additional features compared to v1. However, it still relies on community strings (like passwords sent in plain text), which makes it insecure for sensitive environments.
- SNMPv3: The most advanced and secure version. It supports authentication and encryption, ensuring that SNMP data is protected in transit. SNMPv3 is the recommended choice for modern infrastructures.
In practice:
- v1 and v2c are often still found in legacy systems
- v3 is preferred whenever security is a concern
MetricsHub supports these SNMP versions, allowing you to monitor both legacy devices and modern, security-focused environments.
What does SNMP data look like? (OIDs & MIBs)
SNMP data is exposed through Object Identifiers (OIDs). An OID is a unique identifier that corresponds to a specific metric, such as CPU usage, memory utilization, temperature, or network traffic.
OIDs are expressed as numerical sequences (for example: 1.3.6.1.2.1…) and are organized in a hierarchical structure. While this ensures that each metric is uniquely identified, these numeric paths are not easy to read or interpret.
To make sense of this data, system administrators rely on Management Information Bases (MIBs). MIBs provide human-readable names, organize managed objects, and define their meaning and data types.
Limitations of SNMP Monitoring
While SNMP is powerful and widely supported, it comes with some limitations:
- It relies heavily on polling, which can introduce latency
- Working with OIDs and MIBs can be complex
- Security is limited in older versions (v1 and v2c)
- Data is often low-level and not immediately actionable
Modern solutions like MetricsHub help address these challenges by simplifying data collection, normalization, and integration with observability platforms.
How to Get Started with SNMP Monitoring
Setting up SNMP monitoring typically involves a few key steps:
- Enable and configure the SNMP agent on your devices: This includes defining community strings (v1/v2c) or users and credentials (v3).
- Allow access from your monitoring system: Ensure network connectivity and proper permissions between your monitoring tool and the devices.
- Select the metrics you want to monitor: This often requires identifying the relevant OIDs or using predefined profiles.
- Configure your monitoring tool: Set up data collection, visualization, and alerting.
With MetricsHub, much of this process is simplified. Its built-in connectors and SNMP support reduce the need for manual OID configuration and help you quickly integrate SNMP data into your observability platform.
Bringing SNMP into Modern Observability
SNMP remains a foundational protocol for monitoring infrastructure, thanks to its wide adoption and ability to expose detailed device metrics.
However, its complexity and limitations can make it challenging to use effectively at scale.
By simplifying SNMP data collection and integrating it with modern observability platforms, solutions like MetricsHub allow teams to fully leverage SNMP without the operational overhead.
What to Remember
SNMP remains the foundation of infrastructure monitoring thanks to its broad adoption across network, server, storage, and power devices. MetricsHub simplifies SNMP monitoring by automatically collecting, normalizing, and exporting SNMP telemetry to your OpenTelemetry-compatible observability platform.
Try SNMP Monitoring with MetricsHub