MetricsHub® Enterprise Edition
Bring Infrastructure Monitoring to Enterprise Grade
MetricsHub Enterprise builds on the open-source foundation of MetricsHub Community and delivers enterprise-grade infrastructure observability, with extended hardware and database coverage to support complex, mission-critical environments.
Reliable. Scalable. Professional.
Try it Free! Talk to an Expert Request Trial Extension
Backed by 20+ years of expertise in infrastructure monitoring
Trusted by organizations operating enterprise IT environments


MetricsHub Community as a Foundation
MetricsHub Enterprise includes all the core monitoring capabilities available in MetricsHub Community, providing a proven foundation for infrastructure metrics collection.
Extend Infrastructure Monitoring at Scale
Monitor heterogeneous enterprise infrastructure with out-of-the-box comprehensive coverage.
- Rely on more than 200 built-in Enterprise connectors constantly enhanced and maintained by MetricsHub
- Cover all enterprise manufacturers like Cisco, Dell EMC, HPE, Huawei, and more.
- Monitor enterprise servers, storage systems, network devices, databases, and GPUs across both legacy and cutting-edge architectures, from entry-level to top-tier platforms
- Consolidate infrastructure metrics collection with a single collector, strictly adhering to OpenTelemetry semantic conventions for easy dashboarding, querying, and analysis.


Rely on Enterprise-Grade Support for Mission-Critical Operations
Benefit from premium support services for reliable monitoring operations.
- Access 24x7 expert support to resolve issues faster and maintain uninterrupted monitoring operations.
- Interact live (no chatbot) with our experts through a private Slack channel.
- Benefit from specialized technical support for Prometheus, including installation, configuration, troubleshooting, and optimization.
- Accelerate MetricsHub Enterprise adoption through a dedicated knowledge base and tailored product demonstrations.

Guaranteed 100% success rate
on MetricsHub Enterprise deployment with MetricsHub Support.
What Customers Say About Our Support Services
MetricsHub Enterprise
Because Quality Pays Off!
Improve IT staff productivity by 5% (and more)
- Access to private repositories for simplified deployment and upgrade
- Embedded OpenTelemetry collector for easier deployment
- Access to expert advice 24x7 to get answers instantly without endless internet searches
Save 7% on energy costs
- Tracking of usage and carbon emissions in your entire IT infrastructure to identify and address overconsuming assets
- Temperature optimization recommendations to reduce cooling costs in data center
Reduce downtime by 20%
- Detection of hardware and system failures in 200+ Enterprise systems before they impact the service
- Managed and secured setup to ensure that data collection processes adhere to security best practices, reducing vulnerabilities and safeguarding sensitive information
10% Unlock discounts
- Maximize Savings with Infrastructure Vendors
- Negotiate better deals: With the Enterprise Edition, you gain vendor independence. By not being locked into a single provider, you can compare multiple vendors and secure better pricing, often resulting in up to 10% additional discounts.
- Freedom of choice: Select the best hardware that suits your needs without worrying about compatibility constraints. This flexibility allows you to optimize performance while lowering costs.


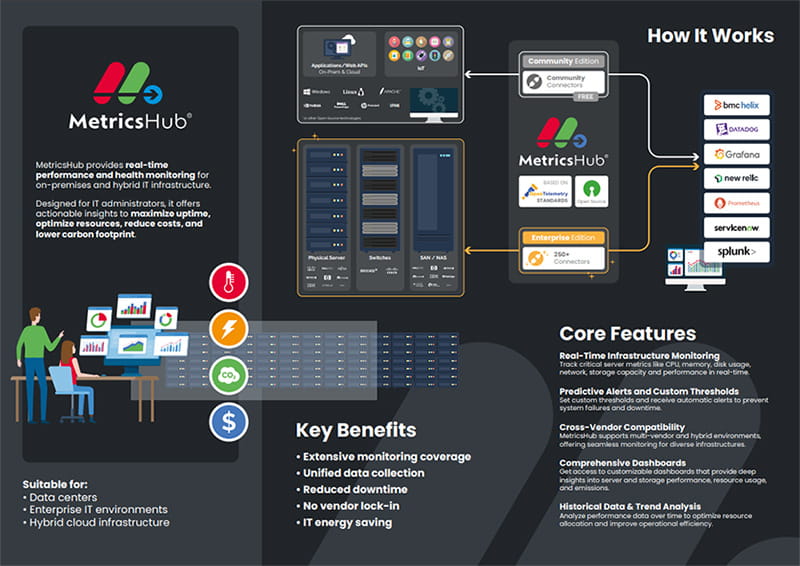
How MetricsHub Enterprise Works
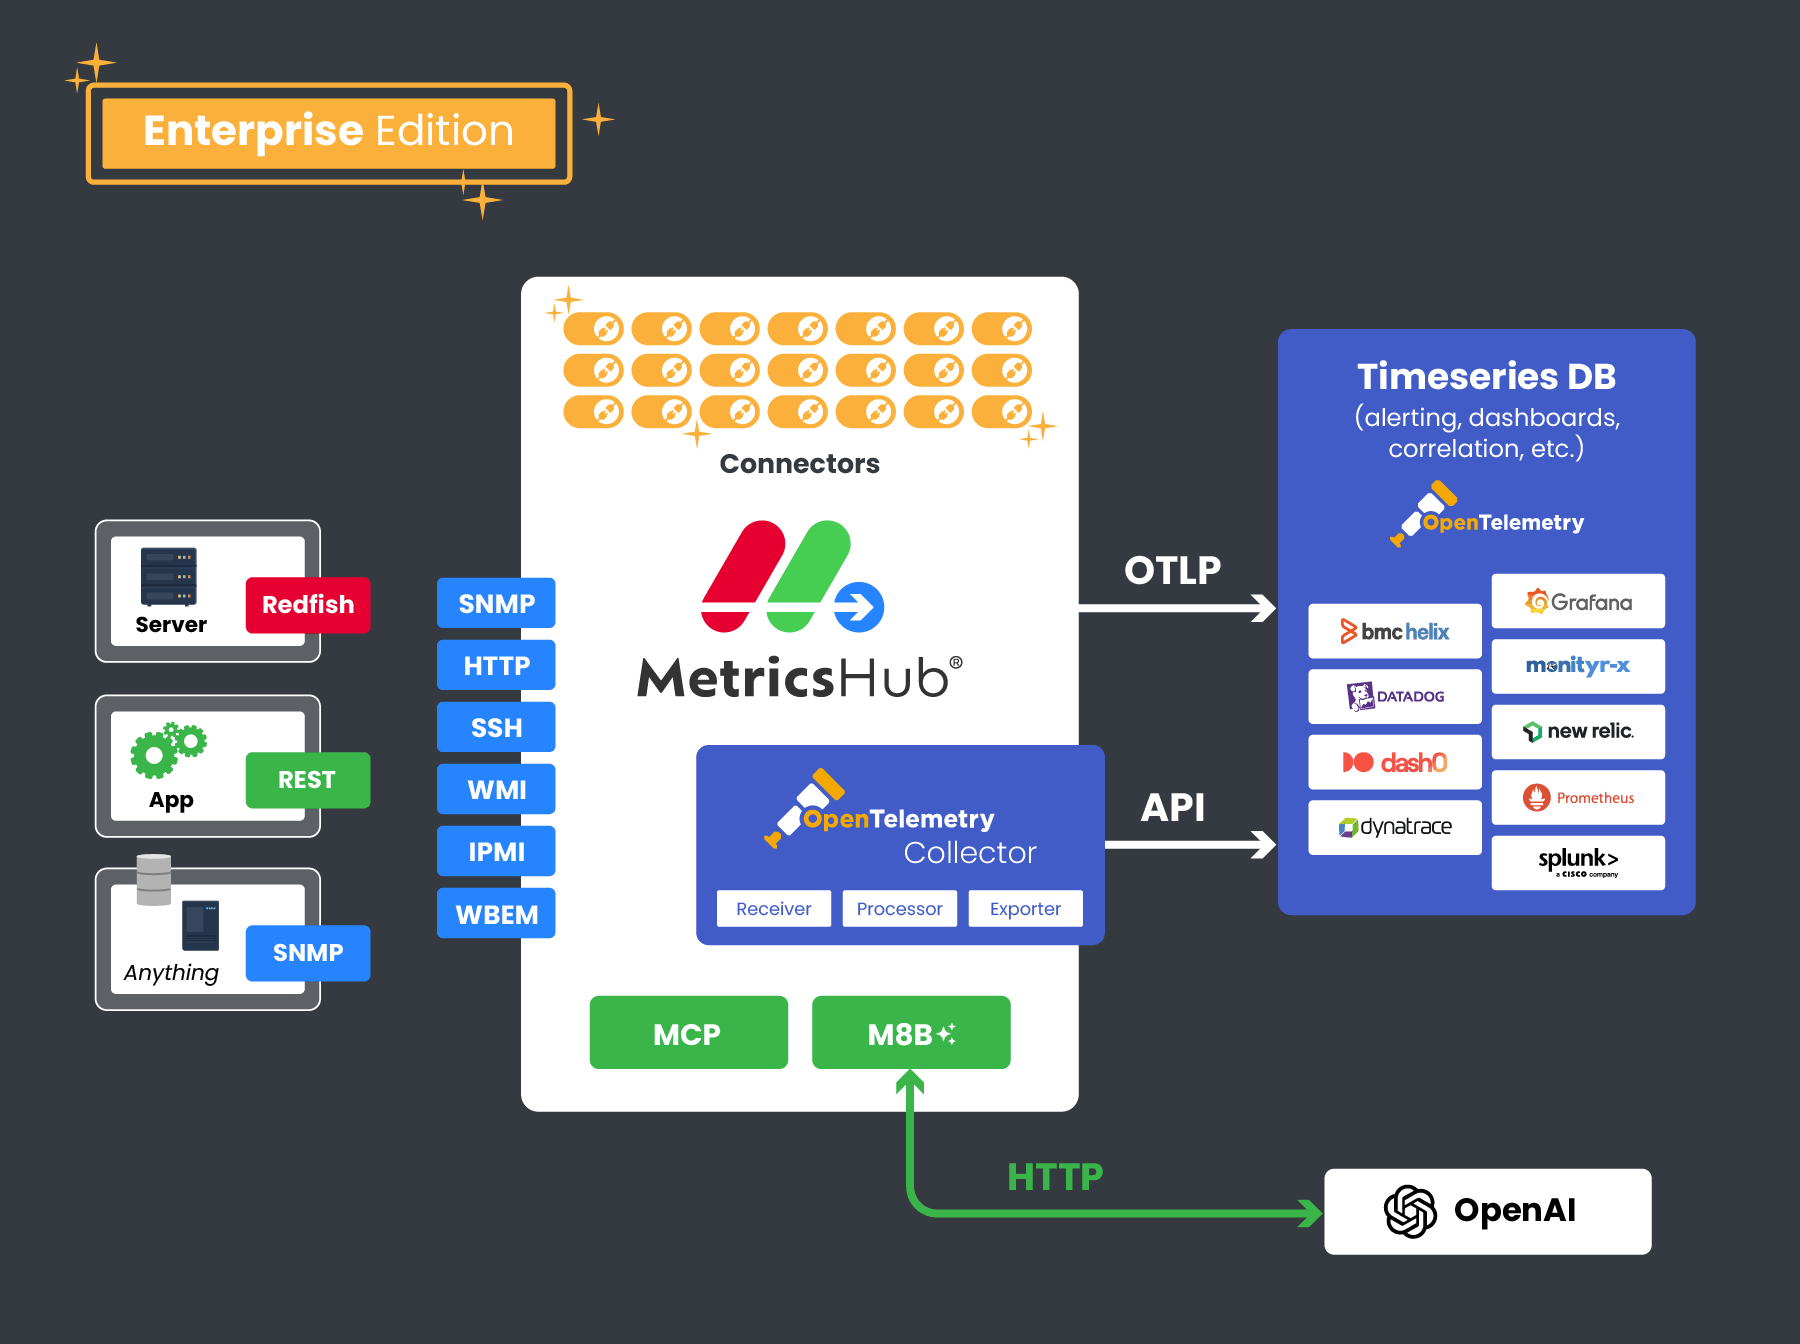
MetricsHub Enterprise operates as a centralized collection agent within your infrastructure network. It extracts telemetry from servers, storage systems, and network devices using standard protocols like SNMP, SSH IPMI, JMX, SQL/JDBC, WMI, and WinRM.
Collected metrics are processed and exported through an embedded, managed, and secured OpenTelemetry Collector, making MetricsHub Enterprise a perfect entry point in modern telemetry pipelines. This design allows infrastructure metrics to flow seamlessly into existing observability platforms, including Prometheus, Datadog, New Relic, Splunk, and others.
MetricsHub Enterprise is well suited for highly secured environments. It can be deployed close to the monitored infrastructure, limiting network exposure and avoiding unnecessary outbound connectivity from monitored systems.
Additional Resources
MetricsHub Brochure
PDF (3.29 MB)- [Blog] Exploring the Landscape of Observability: OpenTelemetry, MetricsHub, and More
- [Blog] Bridging Observability Gaps with MetricsHub & OpenTelemetry
- [Blog] How Much Do Hardware Failures Really Impact Your Uptime?
- [Blog] How We Achieved 100% Monitoring Coverage in Grafana Using MetricsHub
- [Blog] How Many Systems Can a Single MetricsHub Agent Monitor?
FAQ

MetricsHub Enterprise builds on this foundation with extended hardware, storage, and database metrics to support enterprise environments. It includes premium support services for reliable monitoring operations.
To accelerate time to value, MetricsHub Enterprise comes with prebuilt dashboards for selected platforms, enabling immediate visualization and analysis of infrastructure metrics.