MetricsHub
MetricsHub Enterprise 1.0.02
-
Home
- Use Cases
Pinging resources
Overview
With MetricsHub, you can ping any system on the network through ICMP (Internet Control Message Protocol) to verify that it can be reached within an acceptable response time. To achieve this, you only need to configure in the config/metricshub.yaml file:
- the resources to be monitored
- the
pingprotocol for each of your resource.
Once the monitoring is in place, MetricsHub will push the following metrics for each resource (host):
-
metricshub.host.up{protocol="ping"}(1 for successful ping, 0 for no response) -
metricshub.host.up.response_time{protocol="ping"}(response time in seconds)Note: In Prometheus, these metrics will be renamed
metricshub_host_upandmetricshub_host_up_response_time_secondsrespectively, to align with Prometheus naming conventions.
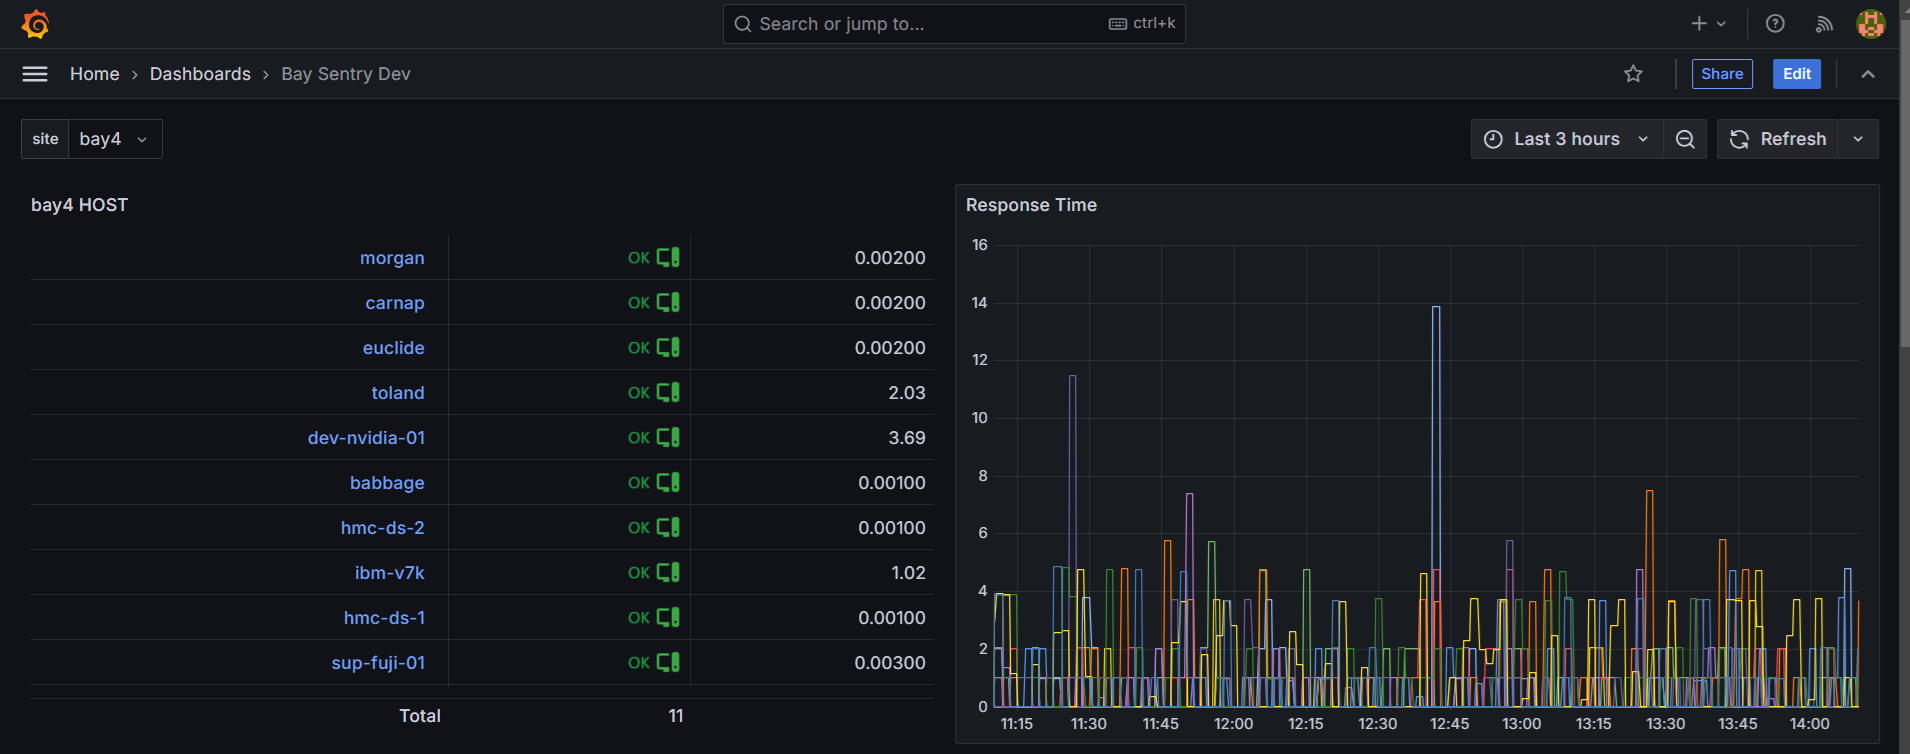
In the example below, we ping 11 devices on the network using the ICMP protocol. A timeout of 3 seconds is configured. The status (OK, KO) and response times are displayed in a Grafana Dashboard.

Procedure
To configure the Ping Check feature:
-
In the
config/metricshub.yamlfile, we configure the 11 devices as follows:resources: host-ping: attributes: host.name: [ euclide, ibm-v7k, carnap, dev-nvidia-01, babbage, morgan, toland, ibm-fs900, hmc-ds-1, hmc-ds-2, sup-fuji-01 ] -
We configure the ICMP protocol as follows:
protocols: ping: timeout: 3s
Here is the complete YAML configuration to be added to config/metricshub.yaml to ping resources:
    resources:
      host-ping:
        attributes:
          host.name: [ euclide, ibm-v7k, carnap, dev-nvidia-01, babbage, morgan, toland, ibm-fs900, hmc-ds-1, hmc-ds-2, sup-fuji-01 ]
        protocols:
          ping:
            timeout: 3s

