Table of Contents
MetricsHub®
MetricsHub Enterprise 3.9.00
-
Home
- Integrations
Prometheus integration
Note: This integration procedure is intended for the MetricsHub Enterprise Edition. If you are using the Community Edition, please refer to Quick Start[1].
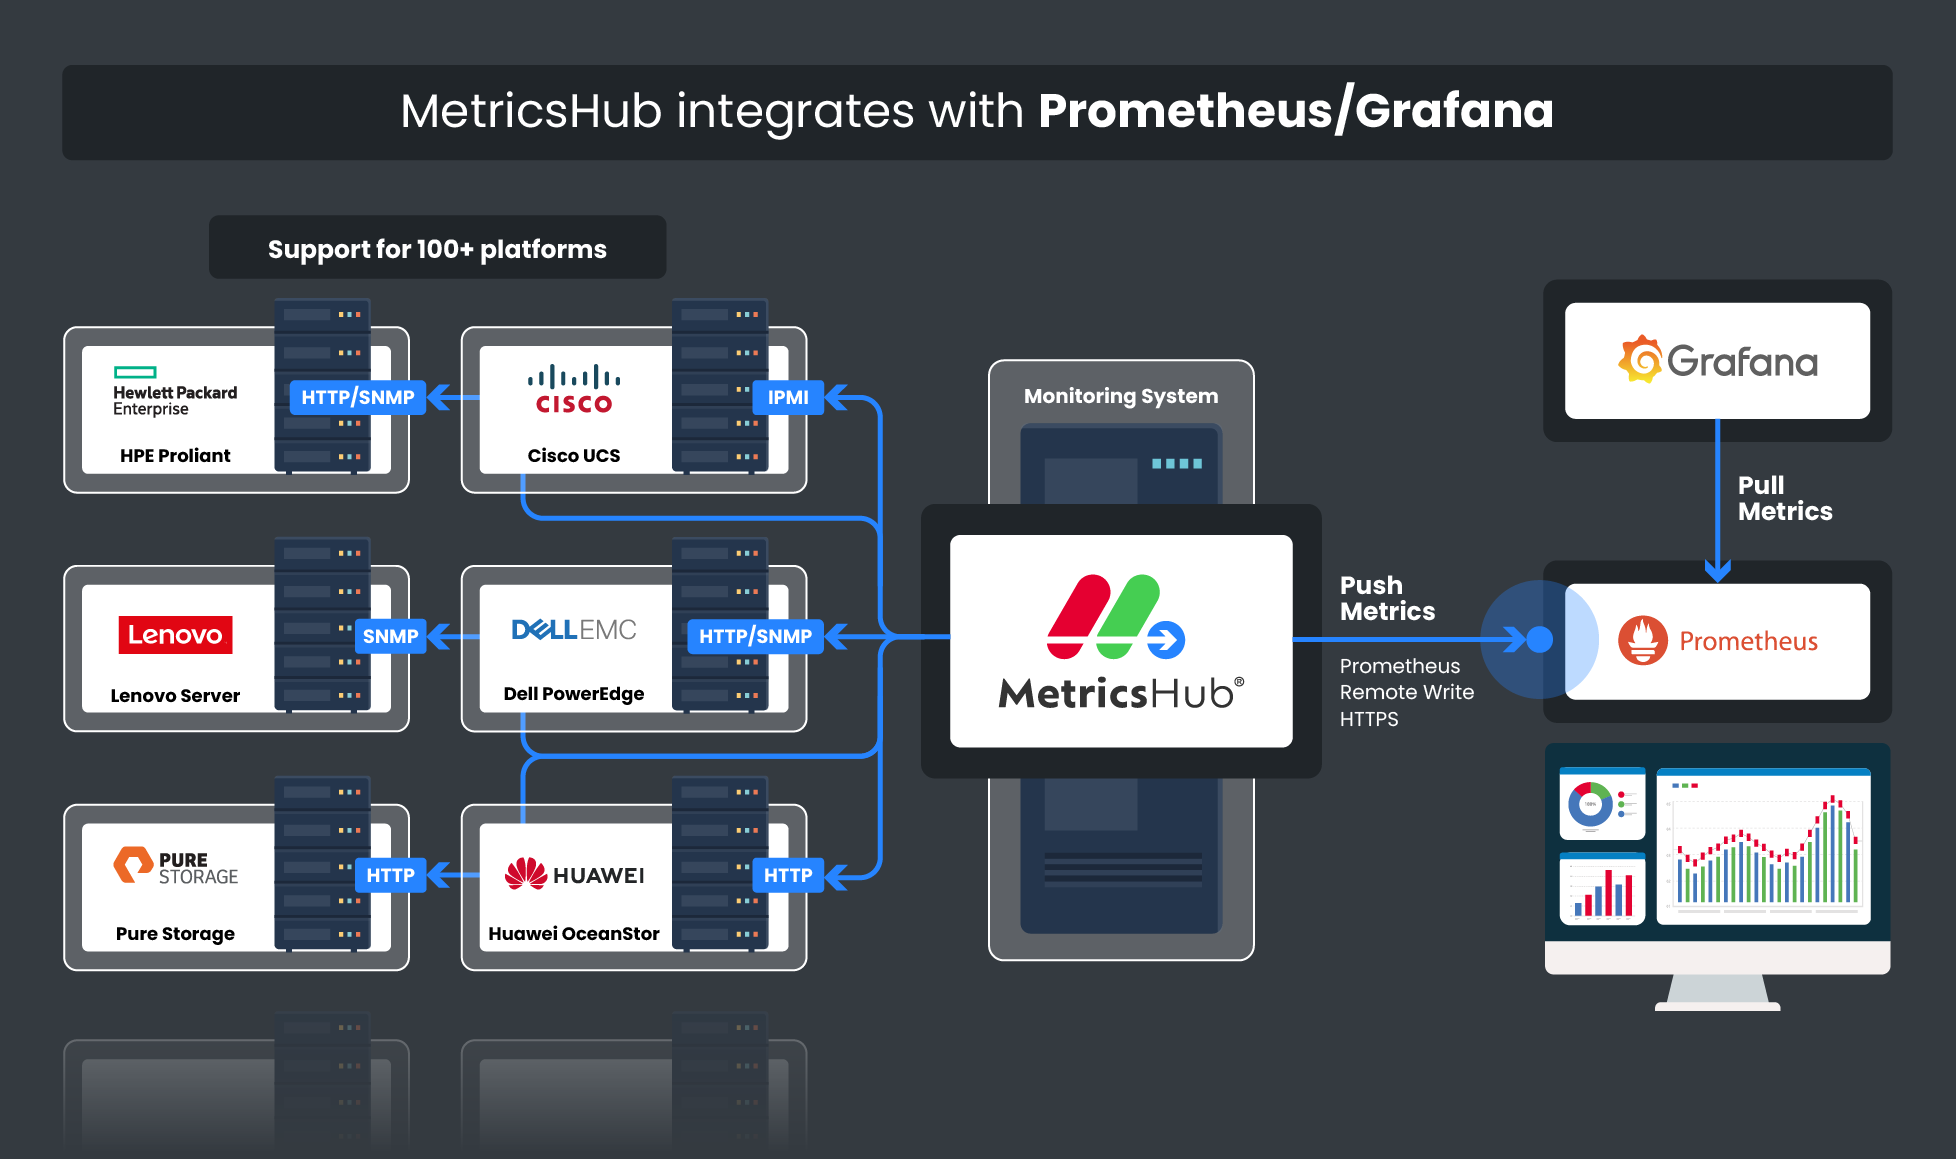
MetricsHub sends the collected metrics to a Prometheus server using the Remote Write Protocol.

Prerequisites
Before you can start viewing the metrics collected by MetricsHub in Prometheus, you must have:
- Installed Prometheus[2]
- Installed MetricsHub[3] on one or more systems that has network access to the resources to be monitored
- Configured the monitoring of your resources[4].
Configuration
-
First, configure your Prometheus server to allow the the Remote Write feature:
- Enable the Remote Write Receiver[5] with the
--web.enable-remote-write-receiveroption - Configure the Remote Write Receiver[6]
- Enable the Remote Write Receiver[5] with the
-
Then, edit the
exporterssection of theotel/otel-config.yamlconfiguration file:exporters: prometheusremotewrite/your-prom-server: # The name of your Prometheus server endpoint: http://your-prom-server:9090/api/v1/write # The URL of your Prometheus server resource_to_telemetry_conversion: enabled: true -
Declare the exporter in the pipeline section of otel/otel-config.yaml:
service: extensions: [health_check] pipelines: metrics: receivers: [otlp, prometheus/internal] processors: [memory_limiter, batch, resourcedetection, metricstransform] exporters: [prometheusremotewrite/your-prom-server] # Declare your prometheus prometheusremotewrite exporter -
Finally, restart Prometheus then MetricsHub to ensure that the configuration changes take effect.
- Prometheus Prometheus Alertmanager Grafana Dashboards
Search Results for {{siteSearch | truncate:'50'}}
{{resultArray.length}}
No results.
