MetricsHub
MetricsHub Enterprise 1.0.02
-
Home
- Use Cases
Monitoring network interfaces using SNMP
Overview
MetricsHub can leverage the SNMP protocol (v1, v2c, or v3) to monitor network devices such as Ethernet switches, UPS, or network interfaces[1], provided that an SNMP agent is installed on the resource and the connection is configured.
In the example below:
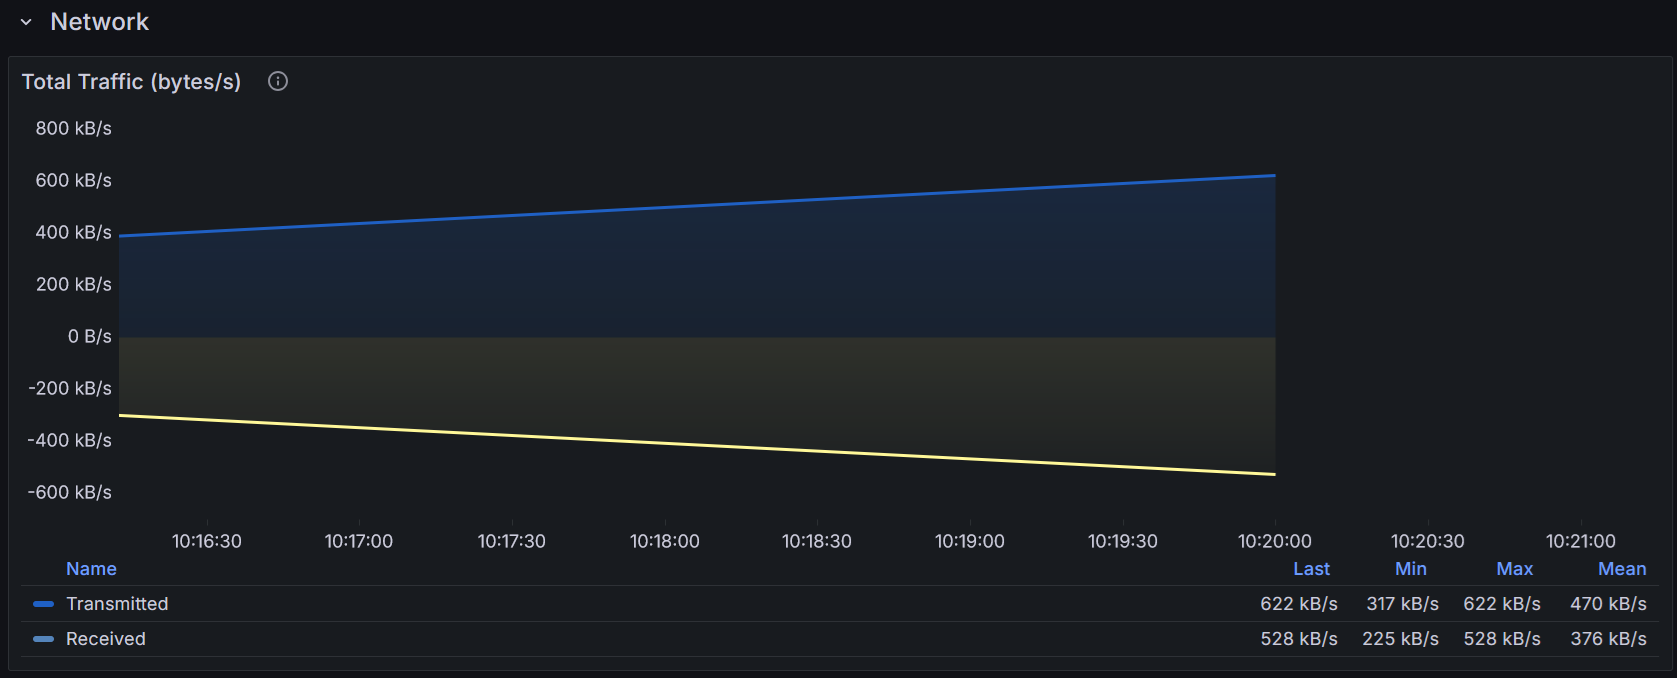
- we configured MetricsHub to monitor a switch using SNMP v2c
- we displayed the total traffic in bytes/s in a Grafana Dashboard

Procedure
To monitor our switch:
-
In the
config/metricshub.yamlfile, we create the resourcealcatel-switchwith the following attributes:- hostname:
alcatel-switch-01 - host type:
network
resources: alcatel-switch: attributes: host.name: alcatel-switch-01 host.type: network - hostname:
-
We configure MetricsHub to connect to the network switch using the SNMP
v2cprotocol and thepubliccommunityprotocols: snmp: version: v2c community: public
Here is the complete YAML configuration to be added to config/metricshub.yaml to monitor the switch:
resources:
alcatel-switch:
attributes:
host.name: alcatel-switch-01
host.type: network
        protocols:
          snmp:
            version: v2c
            community: public
Search Results for {{siteSearch | truncate:'50'}}
{{resultArray.length}}
No results.

