

Blog
How We Added Support for OpenShift in MetricsHub Enterprise
How we built the MetricsHub Enterprise OpenShift connector for remote API collection, OpenTelemetry metrics, and Grafana dashboards.

Key Takeaways
- MetricsHub Enterprise v3.9.08 adds an OpenShift connector that collects Kubernetes resource metrics and OpenShift platform health data.
- The connector collects data remotely over HTTPS without an additional monitoring agent inside the cluster.
- Kubernetes metrics and resource attributes follow OpenTelemetry semantic conventions wherever applicable.
- Development included improvements to API response processing, resource cleanup, and regression testing.
- The Kubernetes Cluster (MetricsHub) dashboard for Grafana visualizes cluster health, capacity, workloads, and updates.
Introduction
One of our customers already used MetricsHub Enterprise to collect hardware health and performance metrics from their servers and storage systems. They wanted to extend that visibility to their OpenShift environment, using the same solution.
At the time, MetricsHub Enterprise didn’t support OpenShift. Their request became the starting point for a new connector. Here’s how we built it and shipped it in MetricsHub Enterprise v3.9.08.
Collecting metrics through Kubernetes and OpenShift APIs
To monitor both Kubernetes resources and OpenShift platform health, we developed a connector that collects data through two sets of APIs.
Kubernetes APIs provide data about nodes, pods, containers, Deployments, StatefulSets, DaemonSets, Jobs, CronJobs, Services, persistent volumes, and resource quotas. Node and pod resource usage is retrieved through the metrics.k8s.io API.
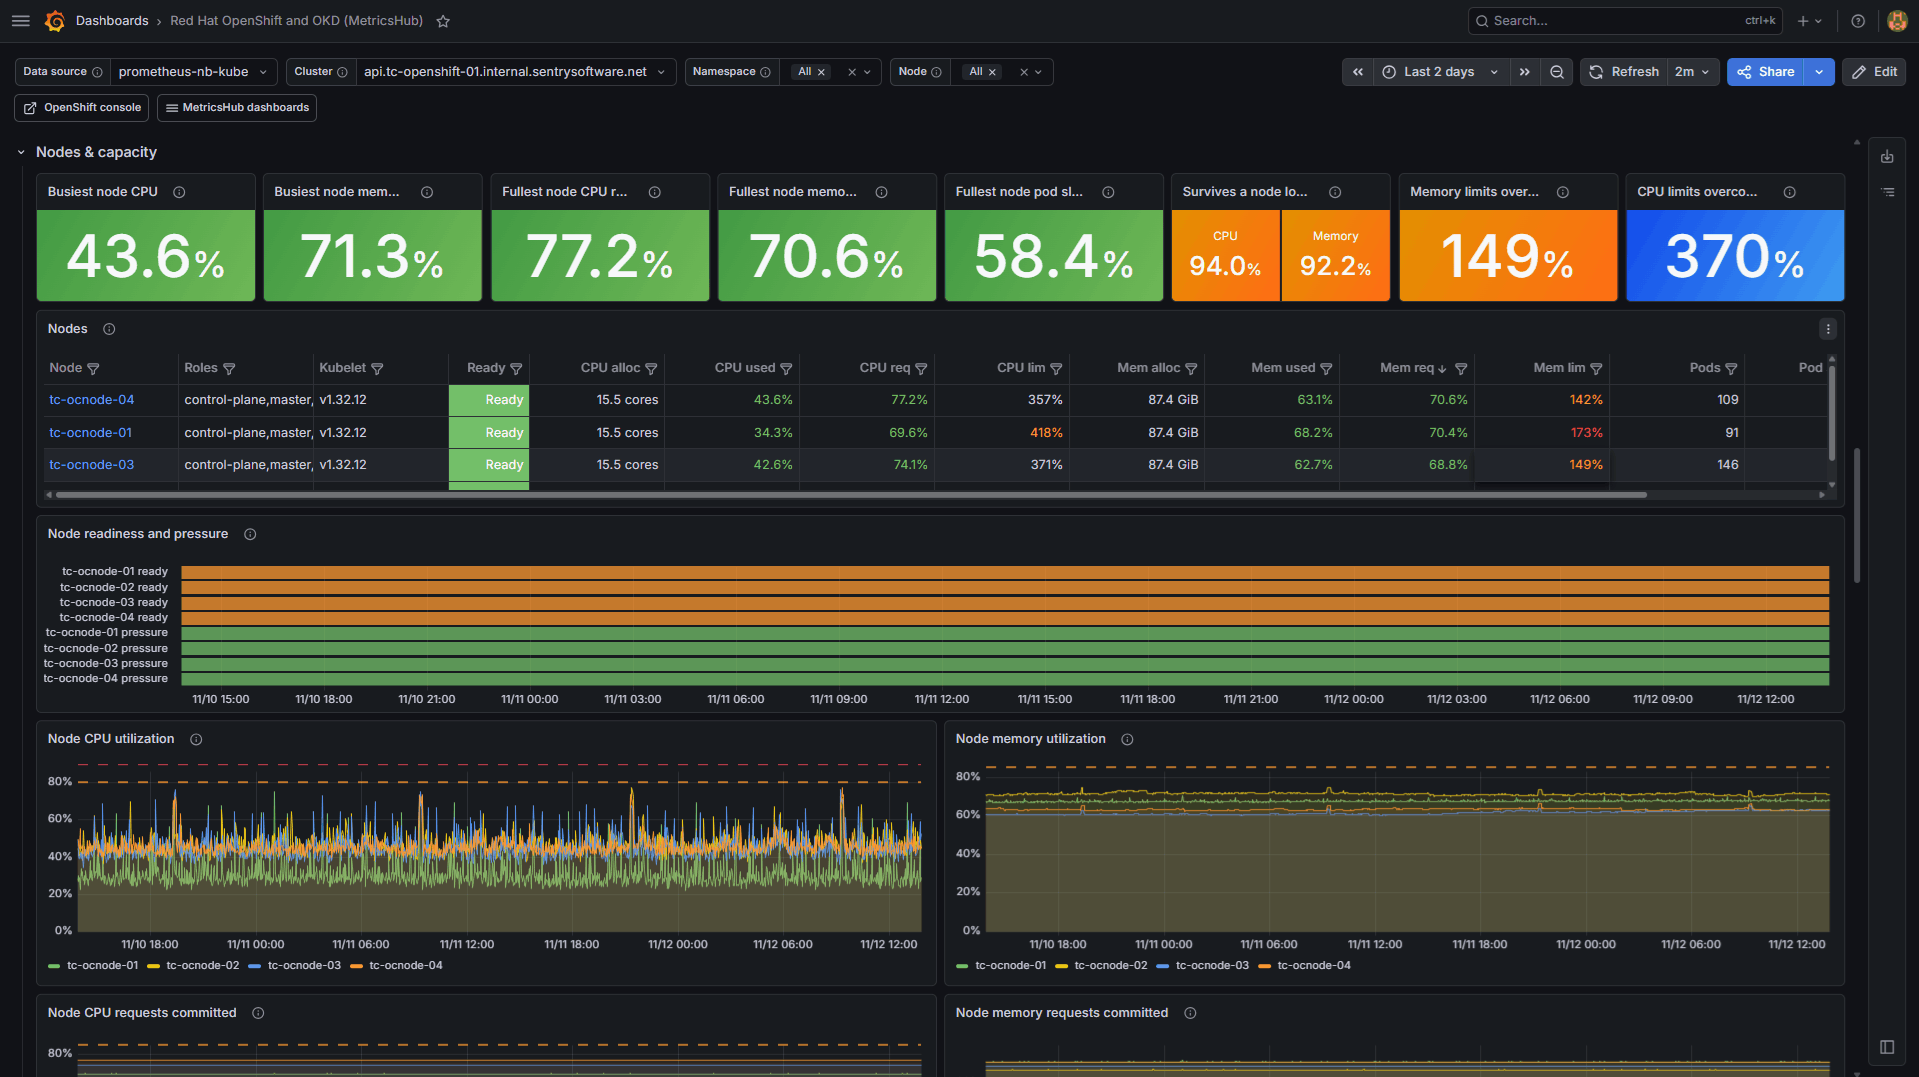
Red Hat OpenShift and OKD (MetricsHub) Grafana Dashboards - Nodes & Capacity
To monitor OpenShift platform health as well, the connector also queries OpenShift-specific APIs:
- ClusterVersion: the current cluster version, update channel, update progress, and number of available updates.
- ClusterOperators: the health of platform components, including ingress, authentication, and the image registry.
- MachineConfigPools: whether node configuration rollouts are progressing or stuck.
- Operators installed through Operator Lifecycle Manager (OLM): their status, update failures, and managed namespaces.
- ClusterResourceQuotas: quotas applied across multiple projects.

Red Hat OpenShift and OKD (MetricsHub) Grafana Dashboards - Cluster Health
MetricsHub Enterprise collects this data remotely over HTTPS through the cluster API, without deploying an additional monitoring agent inside the cluster. Access requires a ServiceAccount assigned the read-only cluster-reader role.
Following OpenTelemetry semantic conventions for Kubernetes
When developing the OpenShift connector for MetricsHub Enterprise, we followed the Kubernetes metric definitions and resource attributes in OpenTelemetry semantic conventions, wherever applicable. This gives the collected data consistent names and attributes, making it easier to interpret alongside Kubernetes data from other OpenTelemetry sources.
The connector uses metric name prefixes such as k8s.node.*, k8s.pod.*, k8s.container.*, k8s.deployment.*, k8s.hpa.*, k8s.persistentvolumeclaim.*, and k8s.resourcequota.*.
Resource attributes follow the same conventions:
k8s.cluster.uididentifies the cluster using the UID of itskube-systemnamespace.- Monitored resources carry the corresponding
k8s.*.nameandk8s.*.uidattributes where applicable.
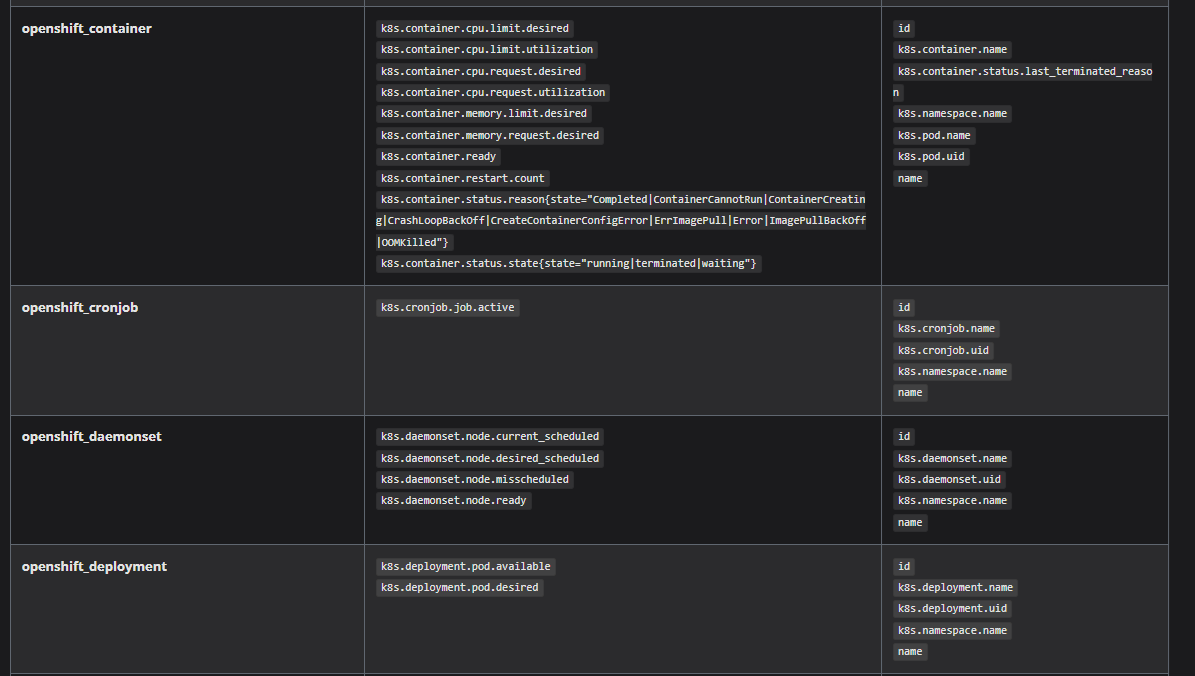
The OpenShift connector follows the semantic conventions for Kubernetes metrics
For OpenShift-specific metrics that are not covered by the OpenTelemetry semantic conventions, we use the openshift.* prefix.

OpenShift-specific metrics not covered by the OpenTelemetry semantic conventions
OpenTelemetry Collector vs MetricsHub Enterprise to collect OpenShift data
The OpenTelemetry Collector collects Kubernetes metrics through receivers deployed inside the cluster. Its OpenShift mode adds support for cluster resource quotas but does not cover OpenShift platform components: cluster version and updates, cluster operators, OLM operators, and machine config pools.
MetricsHub Enterprise extends monitoring to these components using a read-only token, with nothing to deploy inside the cluster. Its metrics follow the current OpenTelemetry semantic conventions for Kubernetes, allowing them to be used alongside the Collector’s metrics in the same backend.
We developed the OpenShift connector to meet three requirements:
-
Collect data remotely without an additional monitoring agent inside the cluster. MetricsHub Enterprise queries the Kubernetes and OpenShift APIs over HTTPS, using a ServiceAccount with read-only permissions. This extends an existing MetricsHub deployment to OpenShift without introducing another monitoring workload into the cluster.
-
Report OpenShift platform health alongside Kubernetes resource metrics. The connector covers cluster updates, cluster operators, node configuration rollouts, operators installed through OLM, and quotas across projects. It reports component health states and accompanying diagnostic information to help administrators identify issues.
-
Use the same collector for OpenShift and its supporting infrastructure. Customers already collecting server, storage, and network metrics with MetricsHub Enterprise can extend their coverage to OpenShift and send the data to their existing observability platform.
The two solutions can also complement each other. Teams can continue using the OpenTelemetry Collector for their existing telemetry pipelines and add MetricsHub Enterprise for the infrastructure and OpenShift coverage they need. By following OpenTelemetry semantic conventions wherever applicable, the connector helps keep that data consistent across sources.
Handling large API responses and changing resources
Building the OpenShift connector also required improvements to how MetricsHub Enterprise processes API responses and handles resources that are frequently created and deleted.
-
Reducing API response sizes. Our initial tests revealed redundant operator data in API responses. By filtering out these duplicate entries, we reduced one response on our lab cluster from 17 MB to 230 KB—approximately a 99% reduction.
-
Processing responses incrementally. We updated the MetricsHub engine to process API responses as they arrive, rather than loading the entire response into memory first. This reduces the memory needed to process large responses.
-
Removing deleted containers from active monitoring. Containers can disappear between collection cycles. We improved the MetricsHub engine to remove deleted containers automatically, keeping active monitoring aligned with the cluster’s current state. This engine improvement also benefits other connectors.
-
Testing normal operation and failure scenarios. We tested the connector against data recorded from a real cluster and additional test cases covering failed components, unusual configurations, and unexpected error messages. These tests help detect regressions as the connector evolves.
Visualizing OpenShift health and performance in Grafana
To help administrators interpret the collected metrics, we developed the Red Hat OpenShift and OKD (MetricsHub) dashboard for Grafana. It provides visibility into:
- Cluster health: status heat maps for the cluster version, cluster operators, installed operators, and node conditions help identify degraded components.
- Resource capacity: CPU and memory usage compared with allocatable resources, broken down by node and namespace, alongside quota consumption.
- Workload health: desired versus available replicas, failing Jobs, pods in
CrashLoopBackOff, and container restarts help identify workloads requiring attention. - Cluster updates: available updates and the progress of an ongoing update.
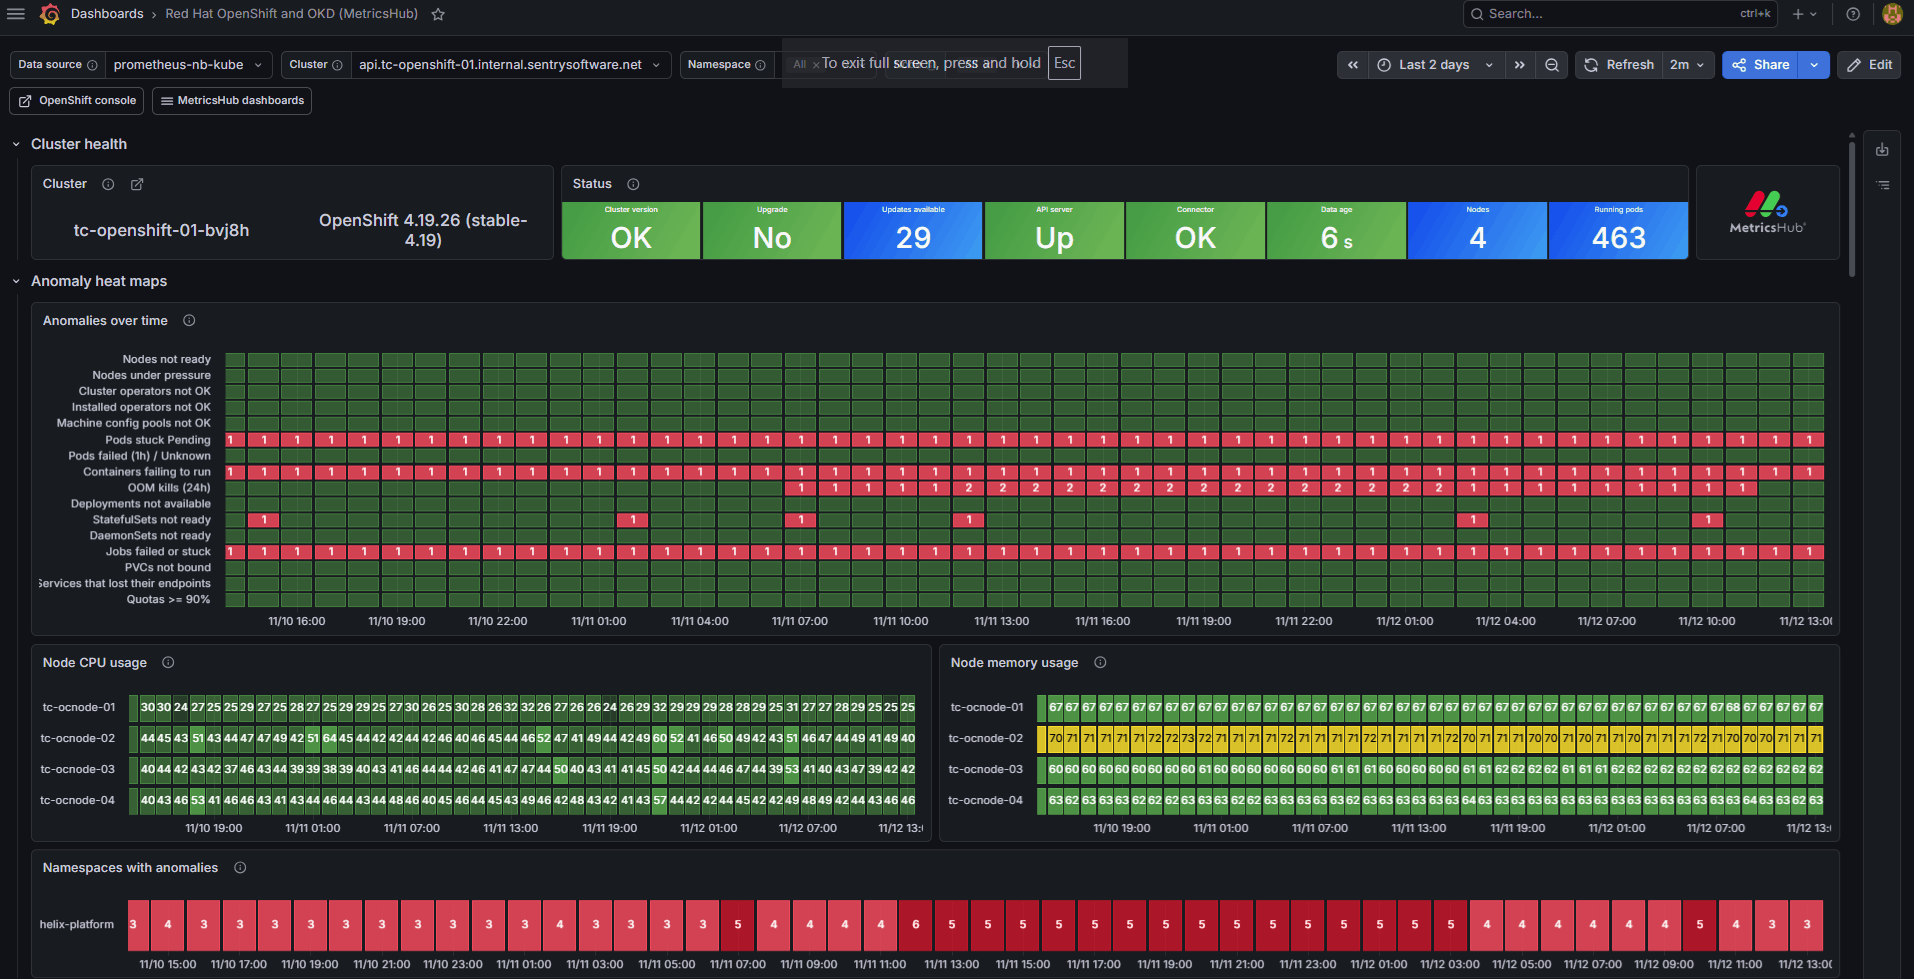
Red Hat OpenShift and OKD (MetricsHub) Grafana dashboard showing OpenShift health, resource capacity, and workloads
Start monitoring OpenShift with MetricsHub Enterprise
The OpenShift connector is available in MetricsHub Enterprise v3.9.08. Extend your metrics collection to include OpenShift platform health, Kubernetes resources, and workload status.
What to Remember
MetricsHub Enterprise extends infrastructure metrics collection to OpenShift, helping teams monitor their clusters and supporting infrastructure through the same collector.
Read the Doc Contact us Download the Red Hat OpenShift and OKD (MetricsHub) dashboard