Deep Infrastructure Monitoring for Prometheus
MetricsHub® extends Prometheus beyond the usual exporters to monitor the physical backbone of IT (servers, storage, hypervisors, and network devices).
Built for scale and simplicity, MetricsHub integrates natively with Prometheus via OTLP, supports more than 100 types of servers and devices, and includes prebuilt Grafana dashboards and Alertmanager rules.
Start Exploring Set it Up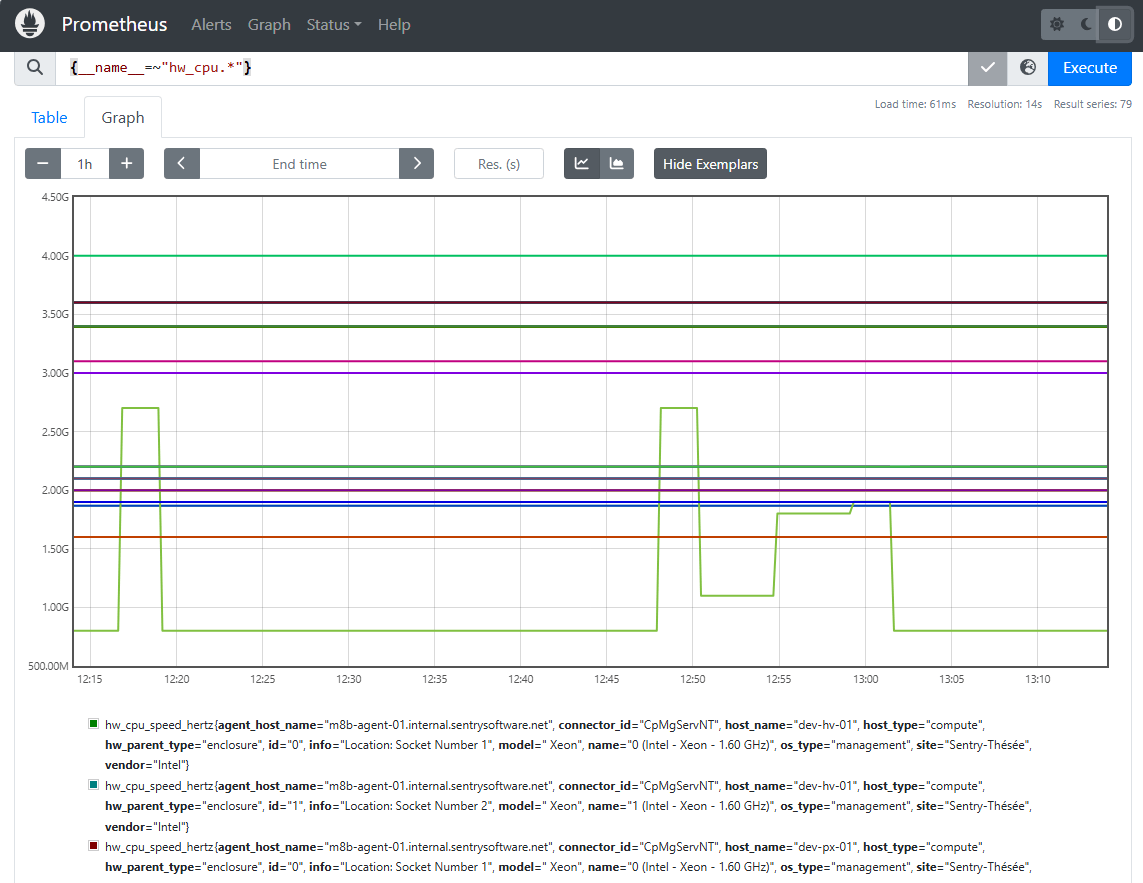
Using VictoriaMetrics, Cortex, Thanos, Grafana Mimir, or M3DB instead?
MetricsHub supports them all too!


250+ Connectors for Enterprise-Grade Coverage
MetricsHub ships with over 250 connectors, giving you comprehensive coverage across:
- 100+ types of enterprise servers and devices from Cisco, Dell EMC, IBM, and Hitachi to HP, NetApp, Pure, and more
- Storage systems from all major vendors
- Databases such as Apache Cassandra, Informix, Microsoft SQL Server, My SQL, Oracle, or PostgreSQL.
MetricsHub delivers full visibility across your IT infrastructure, while eliminating the burden of deploying, managing, and maintaining hundreds of specific exporters.
Explore Supported PlatformsPre-built Grafana Dashboards to Visualize What Matters
Visually striking, polished dashboards only one click-away
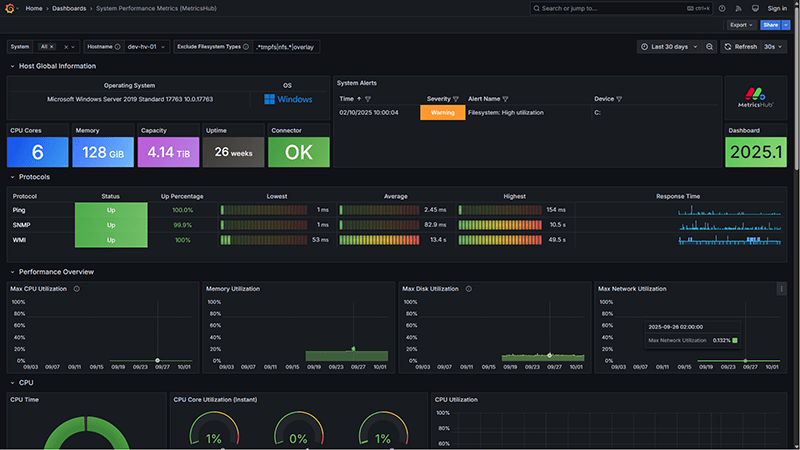
Watch it Live! Import MetricsHub DashboardsSystem Performance Metrics (MetricsHub)
Visualize key metrics from Linux and Windows systems, including CPU utilization, memory consumption, filesystem capacity, network traffic, and protocol response times
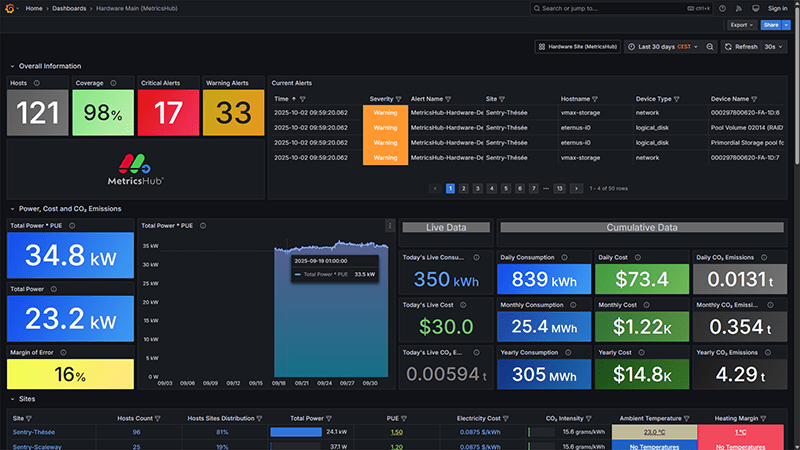
Hardware Main (MetricsHub)
Get a global view of your entire IT infrastructure. Track hardware health, performance, and sustainability KPIs.
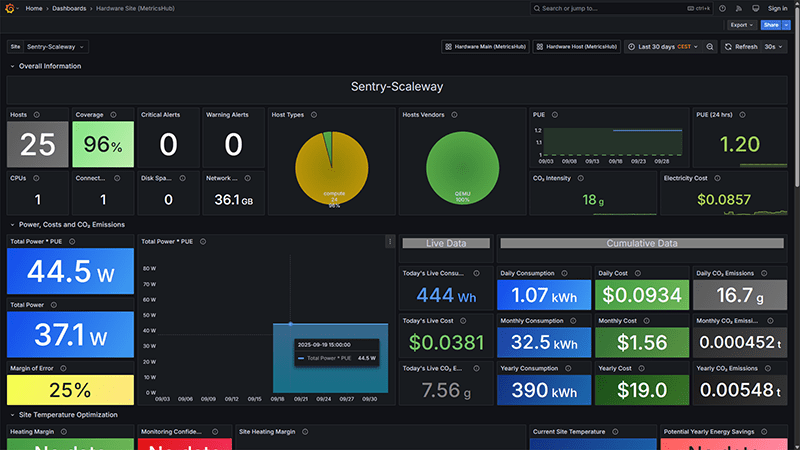
Hardware Site (MetricsHub)
Compare usage and sustainability metrics across sites. Spot inefficiencies and optimize data center operations.
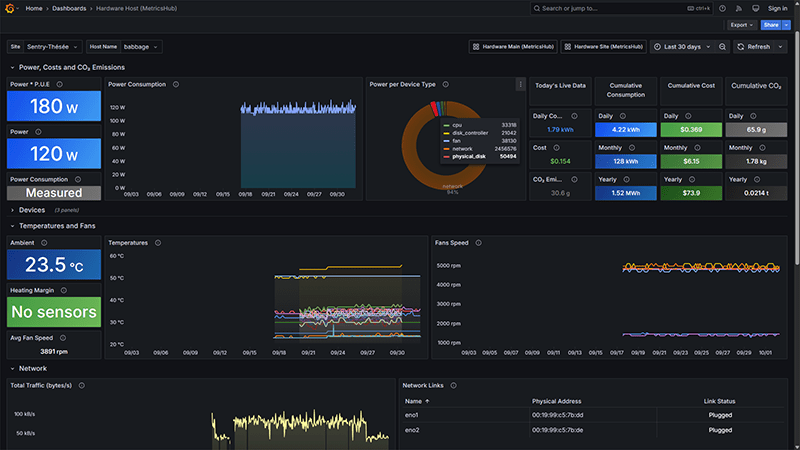
Hardware Host (MetricsHub)
Zoom in on individual hosts to monitor performance, detect issues early, and improve energy efficiency.
Ready-to-Use & Reliable Prometheus Alertmanager Rules
Explore Built-in Rules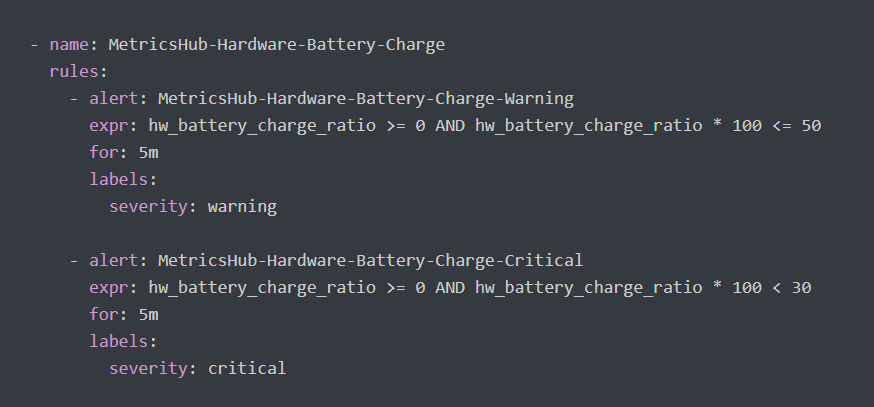
System Performance & Resource Usage
Detect abnormal CPU, memory, filesystem, or bandwidth usage, as well as excessive page faults or high network error rates.
Agent & Connector Reliability
Be informed immediately if a MetricsHub agent, connector, or monitored protocol fails or if the agent stops sending metrics.
Hardware Lifecycle & Predictive Failure
Anticipate risks by detecting degraded, missing, or at-risk devices, as well as low disk endurance and high device error rates.
Cooling & Temperature Monitoring
Identify overheating risks or insufficient fan speeds before they cause hardware damage.
Storage & Pathing
Ensure availability by monitoring LUN multipathing issues or missing storage paths
Network Connectivity
Get notified instantly when a host cannot be reached, or when network cards report excessive errors.
Power & Battery Health
Spot voltage fluctuations, overloaded power supplies, or batteries with critically low or abnormal charge.
Our Commitment to Open Source
MetricsHub is committed to the open-source initiative. Support for open-source technologies is continuously added to the Community Edition of MetricsHub, which is free and open-source.
MetricsHub Community monitors:
- Linux and Windows systems
- Hardware through standards (IPMI, RedFish, SNMP, WMI)
- Open-source databases (Apache Cassandra, MySQL, PostGreSQL)
- Sustainability metrics
Shape the Future of MetricsHub
Contribute to an open-source roadmap that advances observability for teams everywhere.
Get Started with MetricsHub Community Contribute on GitHub
Key Features
Scalable Remote Monitoring
Monitor up to 1,000 systems from a single MetricsHub instance. No need to deploy agents on every host. Achieve faster time-to-value and simplify ongoing maintenance.
System performance monitoring
Monitor critical performance indicators on Linux and Windows systems, including CPU, memory, filesystems, disks, and network, to maintain smooth operations and detect bottlenecks early across your infrastructure.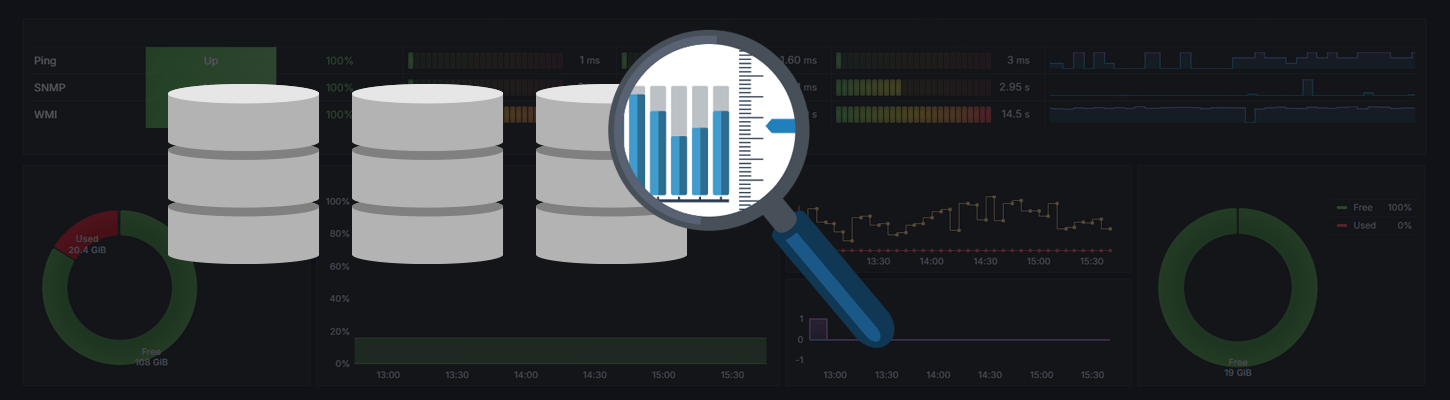
Database Monitoring
Monitor key database metrics, such as query latency, I/O performance, cache efficiency, connection counts, memory usage, and error rates, to detect bottlenecks, optimize caching, manage connections, and improve application responsiveness.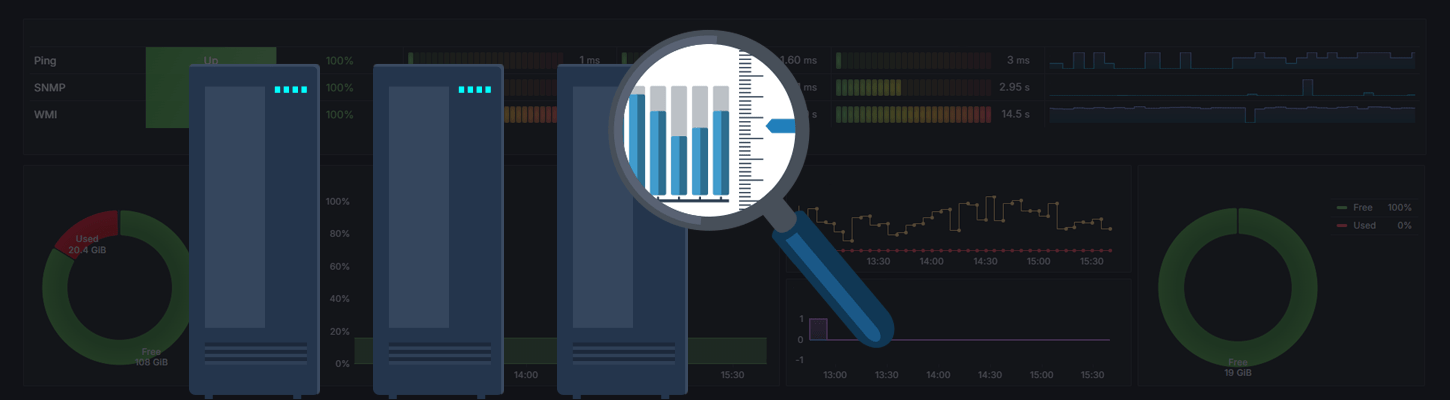
Storage Monitoring
Monitor health, capacity, and performance across disks, volumes, and controllers. Track I/O, latency, usage, endurance, and environmental data.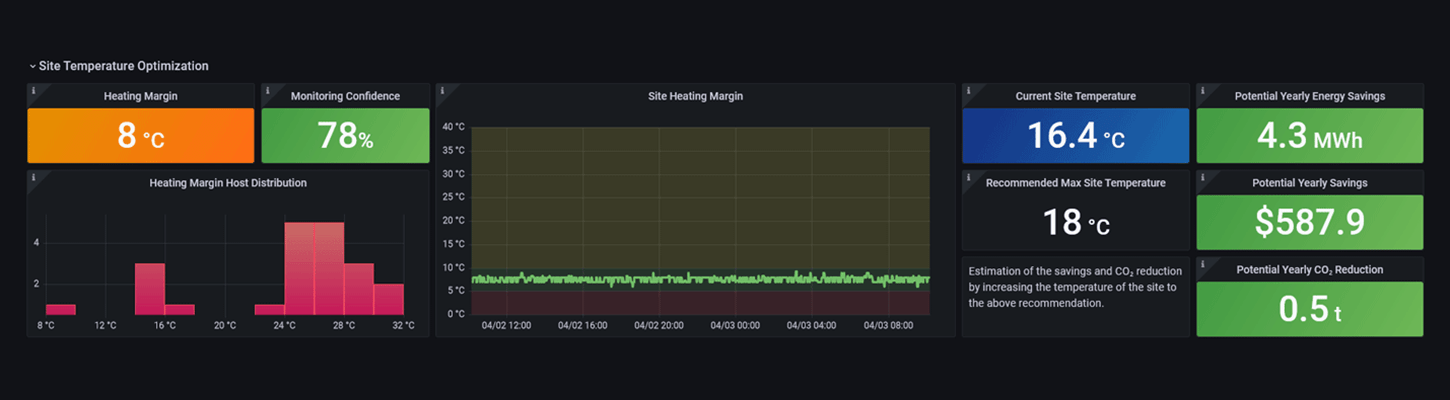
Sustainability Insights
Track electricity usage and CO₂ emissions across your IT infrastructure and optimize data center temperature to cut energy costs and reduce your environmental footprint.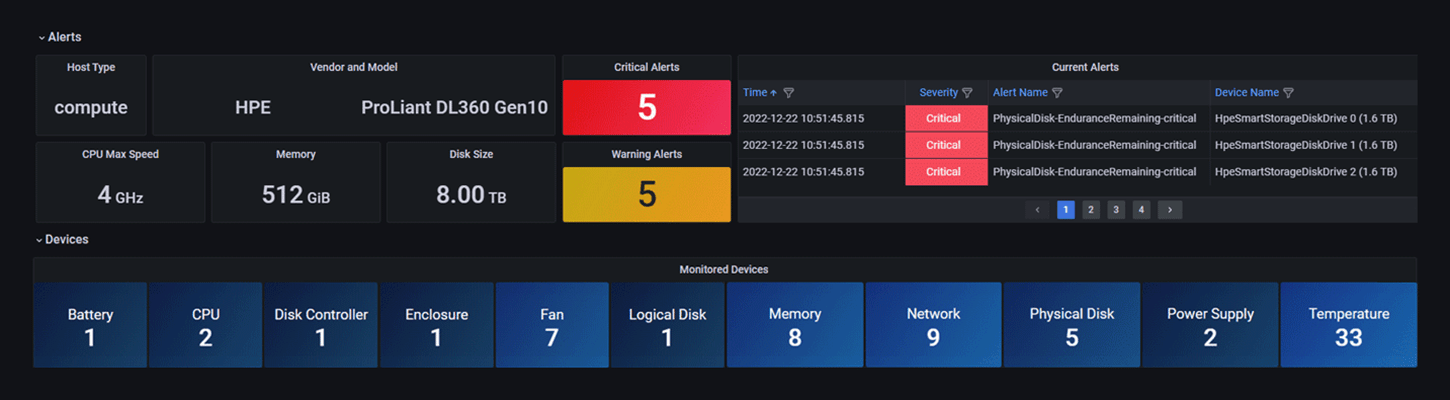
Hardware monitoring
Detect and predict failures in processors, memory modules, disks, network cards, controllers, power supplies, fans, temperature sensors, and more.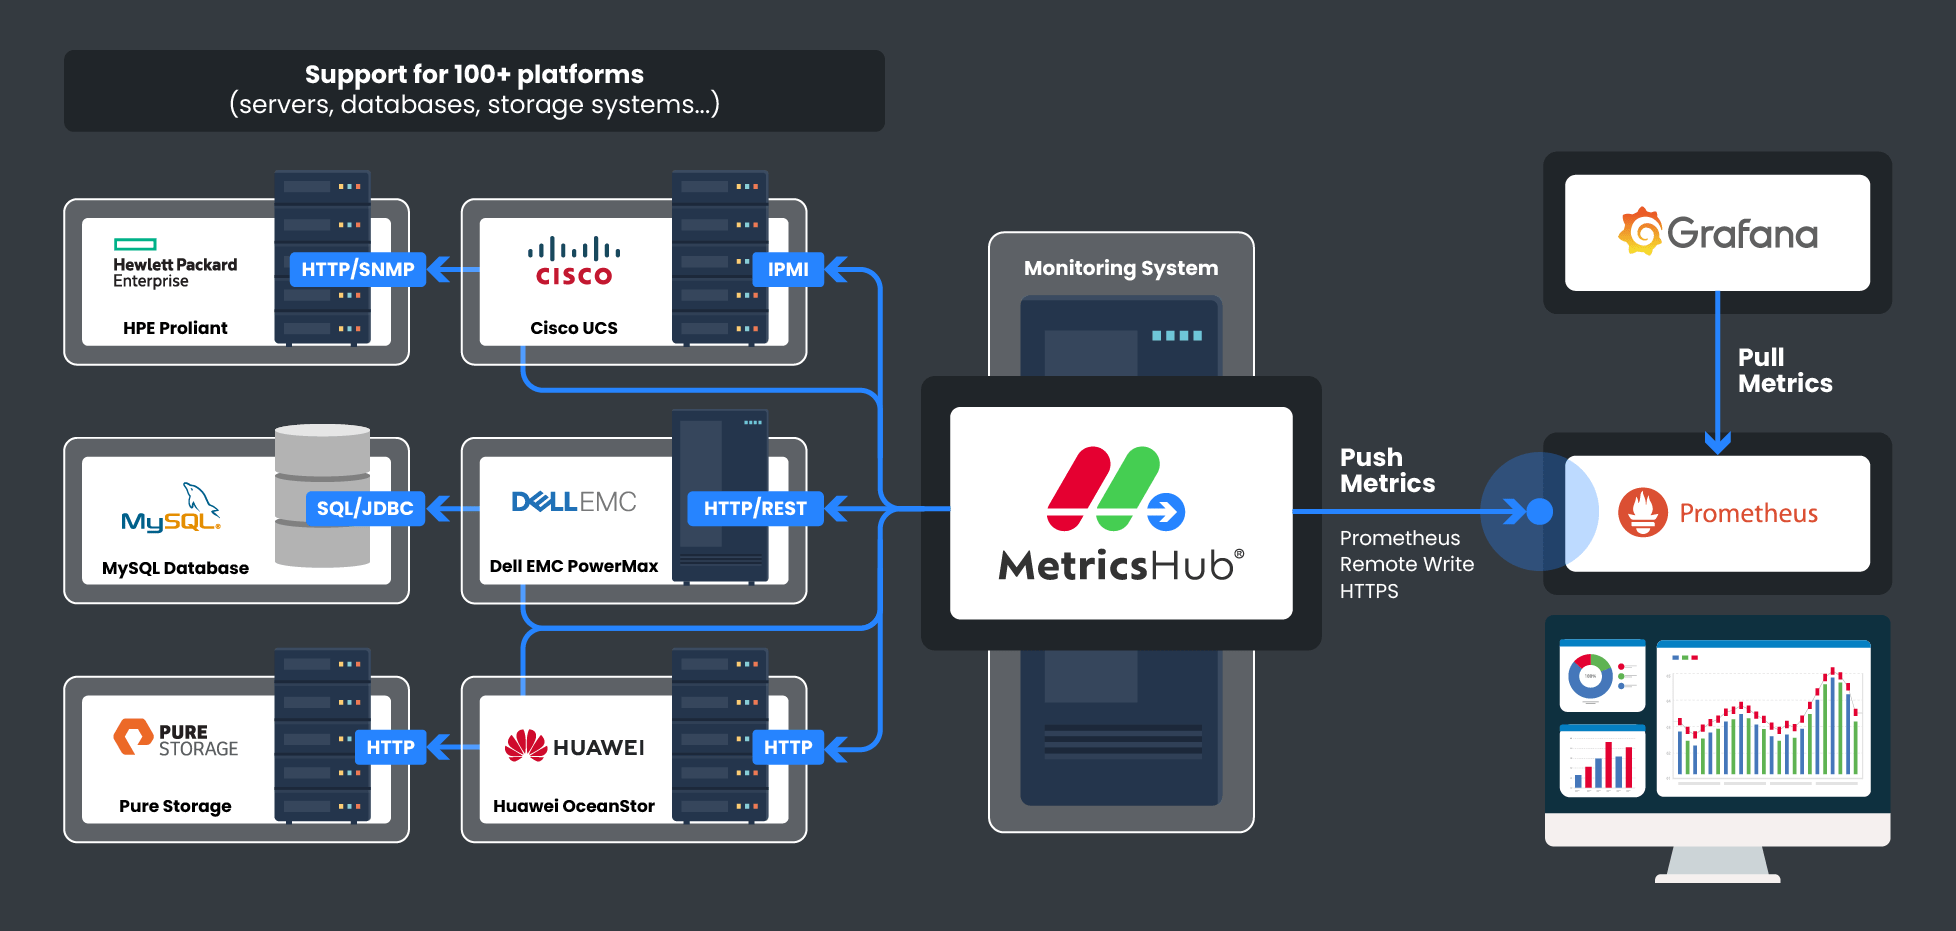
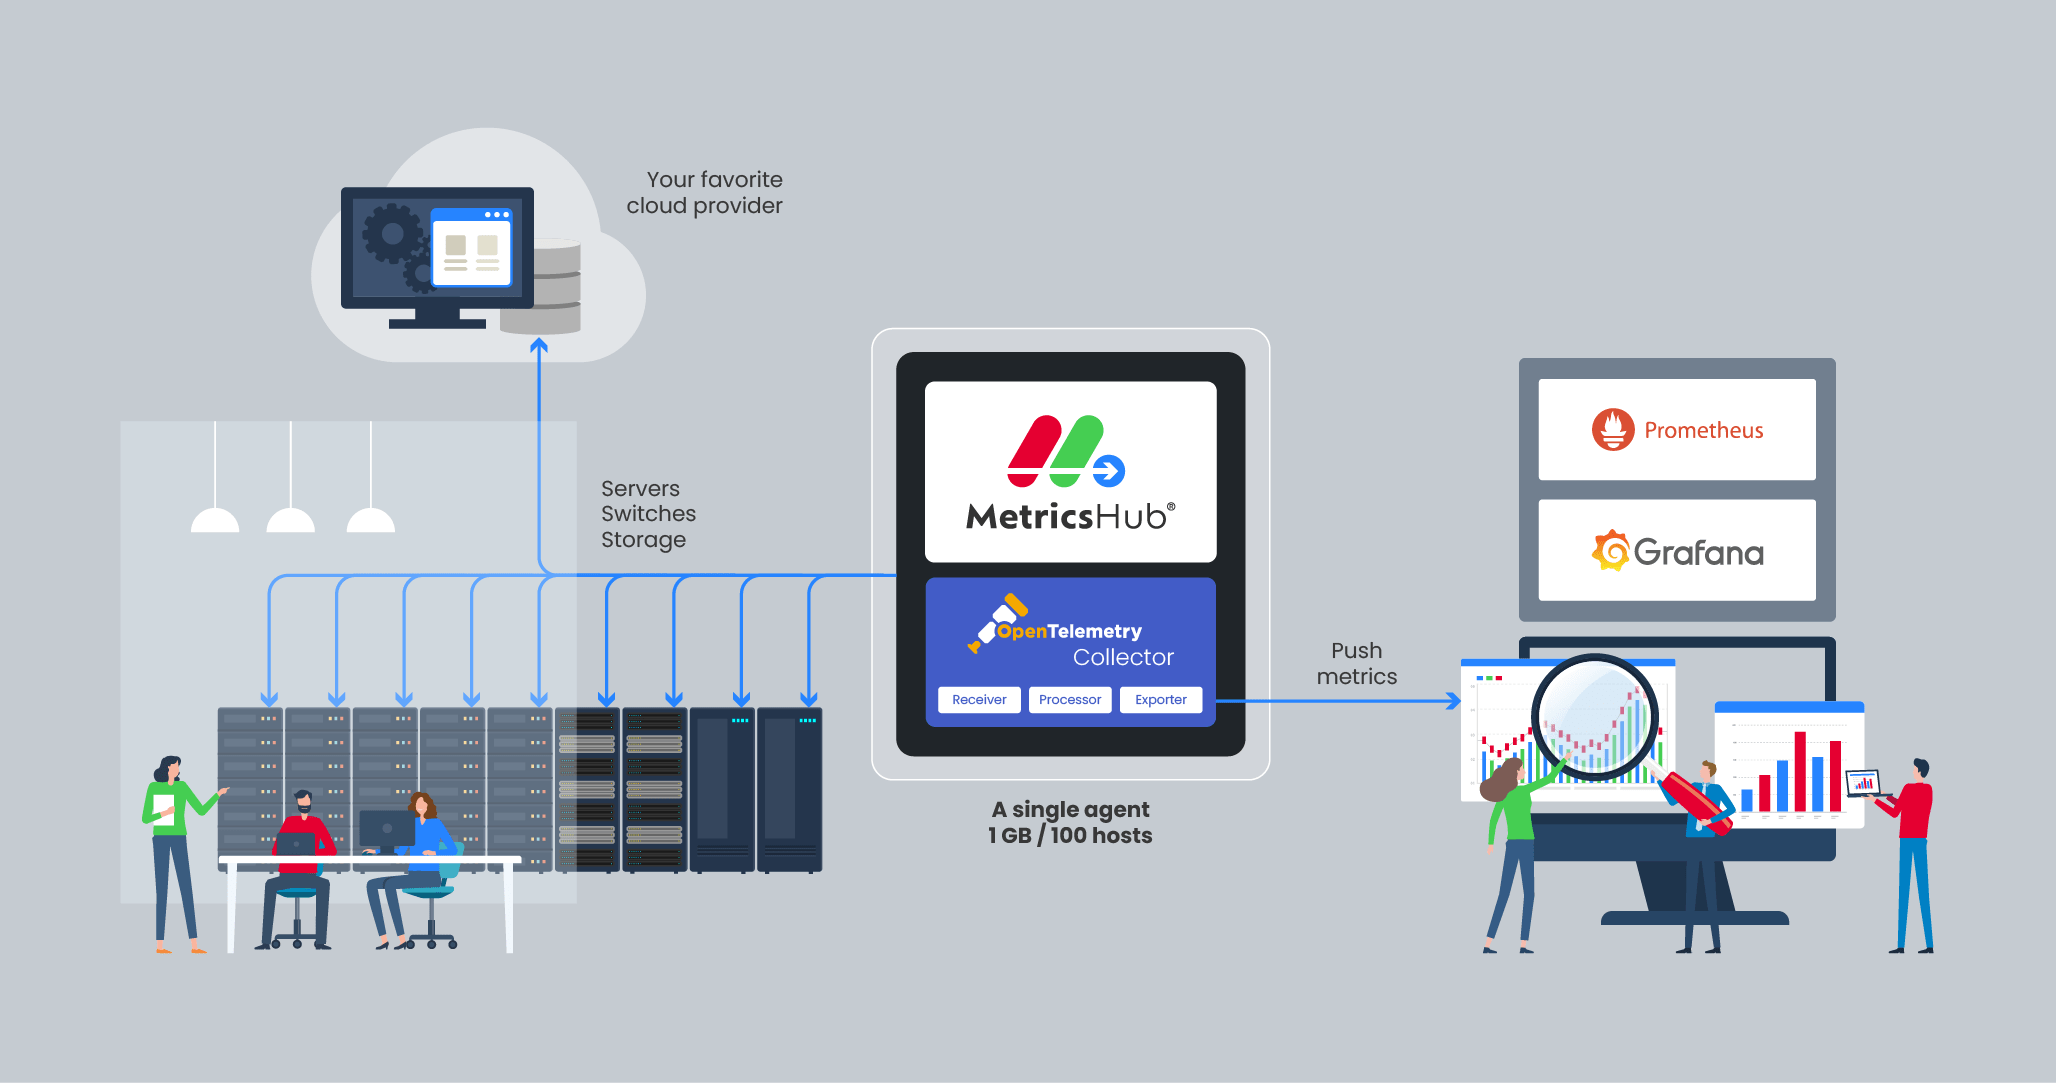
How MetricsHub Works
MetricsHub collects detailed health and performance metrics across your infrastructure, covering servers, storage systems, databases, and network devices, and pushes them to Prometheus. These metrics can then be visualized in real time in Grafana using MetricsHub's prebuilt dashboards.
Effortless Integration in Just a Few Steps
-
1
Install MetricsHub Enterprise
Fast setup with installable packages for RedHat, Docker, and Windows.
-
2
Configure Resource Monitoring
Comprehensive coverage of servers, storage, networks, databases, and services.
-
3
Push metrics to Prometheus
Either directly with OTLP or through the OpenTelemetry Collector
-
4
Import Prebuilt Grafana Dashboards
Instant visibility without manual dashboard creation
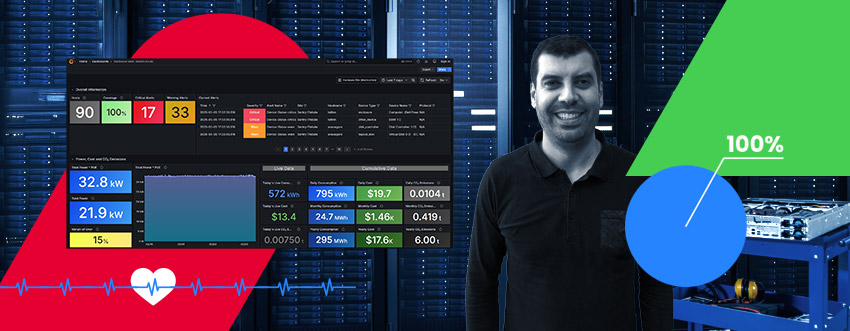
MetricsHub in the Field
Real-World Deployments and Practical Outcomes

Learn why most system dashboards fail in real-world operations and how our system dashboards for Grafana deliver clear, decision-ready visibility across Windows, Linux, AIX, and HP-UX systems.

MetricsHub successfully reduced its data center's electricity consumption by 15% while also lowering carbon emissions.
Over 80 systems from 20 different vendors monitored in one unique console!

How a Leading Telco Achieved Unified Observability in Just 5 Months
Managing 6,000+ servers across multiple vendors was a challenge—fragmented tools, delayed alerts, and operational inefficiencies put service quality at risk.
MetricsHub changed the game.
Why MetricsHub?
Scalable by Design
Manage up to 1,000 systems from a single MetricsHub instance. No agents required on each host.
Broader Infrastructure Visibility
Monitor physical servers, storage systems, hypervisors, network devices, and more.
Extensible
Build custom connectors for unique devices or use cases.
Direct OTLP Integration
Send metrics straight from MetricsHub to Prometheus using the new OTLP-native ingestion endpoint introduced in Prometheus v3.x.
All-in-One Metrics Collection Agent
Skip the complexity of juggling multiple exporters. MetricsHub connects to hundreds of platforms out of the box, ensuring faster time to value.
BONUS - Actionable Insights for IT Sustainability
Track energy usage and carbon footprint. Optimize cooling to reduce your environmental footprint.
Ready to Get Started?
See MetricsHub in Action
Request a tailored demo or proof of concept and experience its capabilities in your unique environment.
Request a DemoTake Prometheus to the Next Level
Extend your Prometheus-based observability to the physical layer with MetricsHub.
Try It FreeHave Questions?
Need additional information to enhance your current Prometheus setup? Our team is only one message away to assist you.
Contact Us