Full Infrastructure Monitoring in Datadog
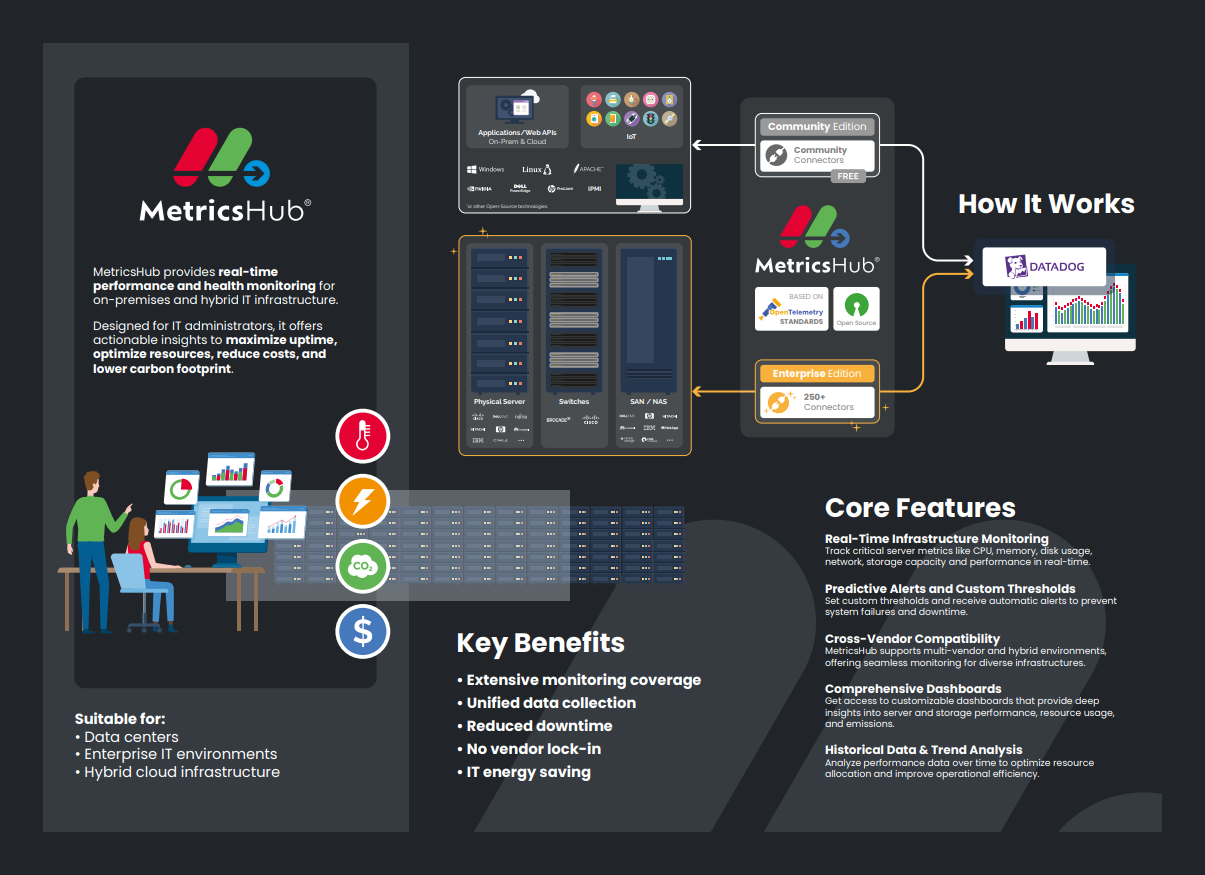
With MetricsHub®, gain real-time visibility into hardware health, system performance, and sustainability metrics across servers, storage, and networks—helping you prevent failures, optimize costs, and run greener data centers.
Watch it Live! Try it Free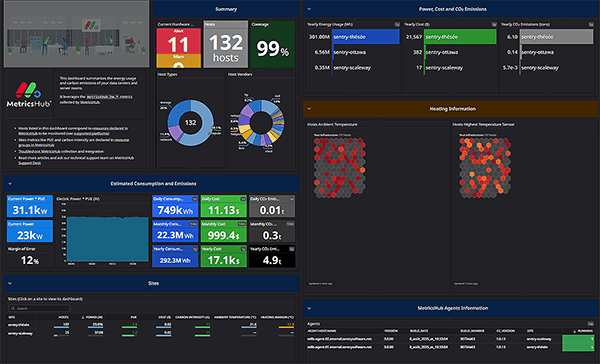


One Single Solution to Cover 100+ Platforms
With more than 250+ prebuilt connectors, MetricsHub brings unmatched infrastructure coverage to Datadog:
- Servers: Dell PowerEdge, Cisco UCS, Fujitsu PRIMERGY, HPE ProLiant, Lenovo ThinkSystem, IBM POWER, SuperMicro, and many more.
- Systems & Hypervisors: Linux, Microsoft Windows, VMware, Proxmox.
- Storage Systems: NetApp, Dell EMC, Hitachi, HPE 3PAR, Huawei OceanStor, IBM FlashSystem, Pure Storage, Synology, and more.
- Network Devices: Cisco, Juniper, Arista, F5, HPE Aruba, Extreme Networks, and any MIB-2 compliant device.
- Databases: Microsoft SQL Server, MySQL, PostgreSQL, Oracle Database.
- Other Devices: APC, Citrix NetScaler, Eaton, Raritan
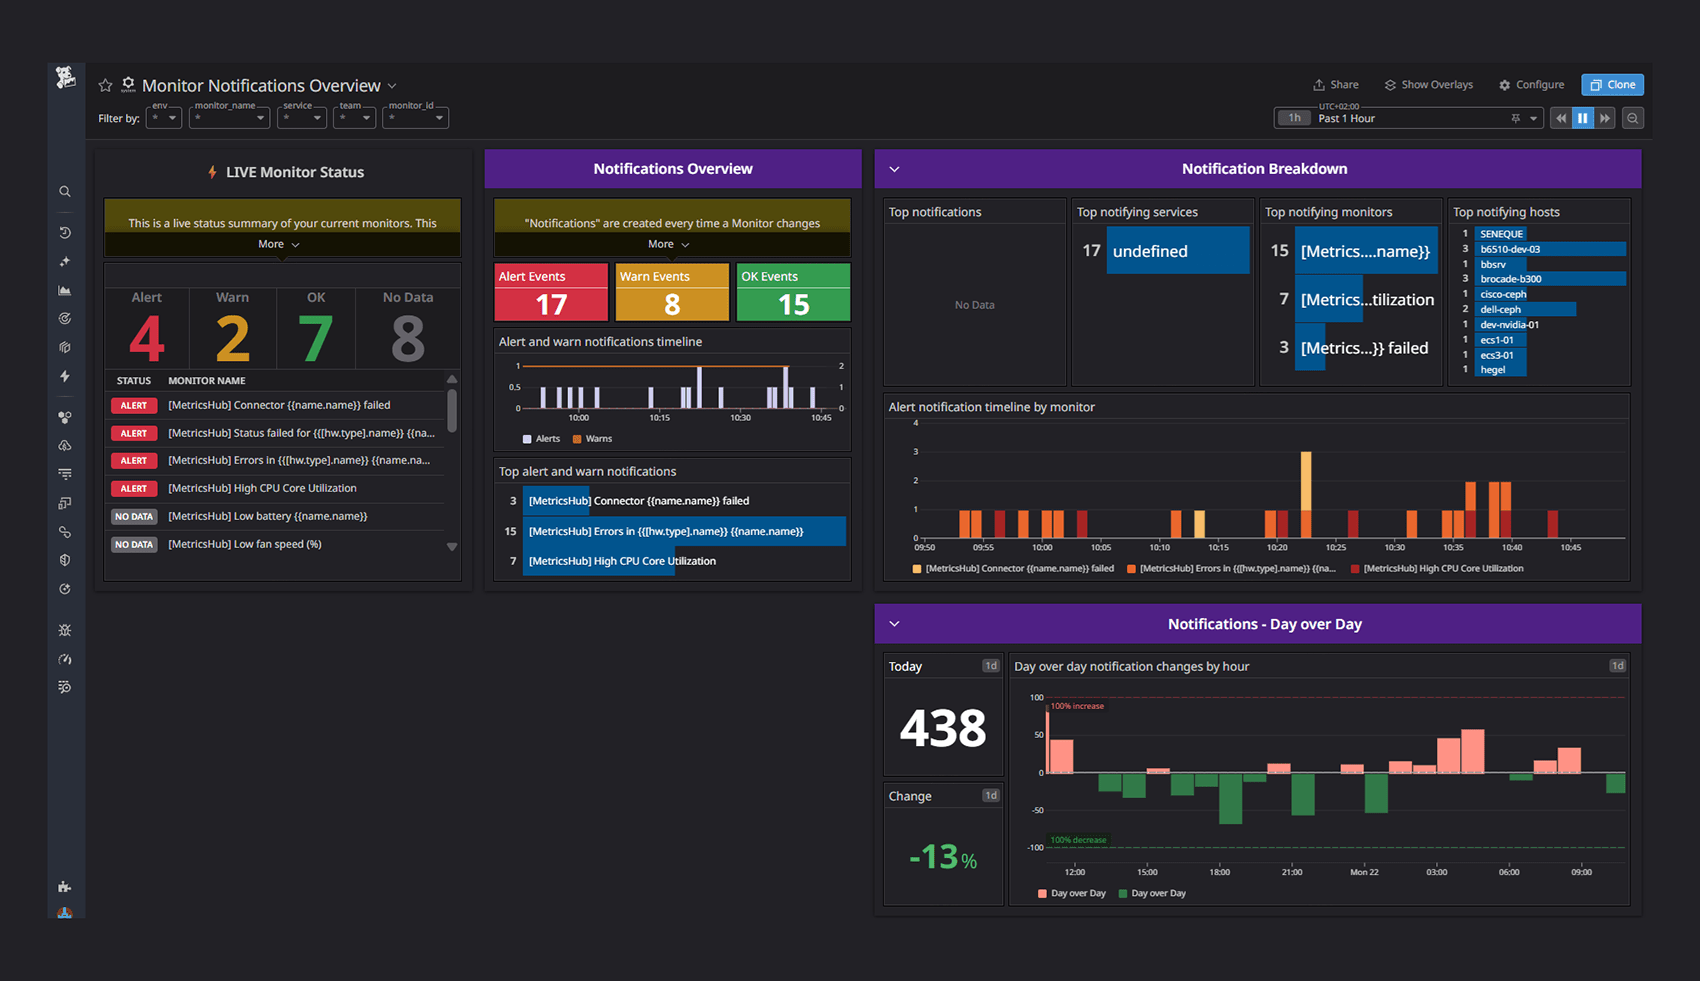
Prebuilt Dashboards for Instant Insights

MetricsHub Hardware Overview
Overview of all monitored systems, focusing on key hardware and sustainability metrics.
Watch it Live!
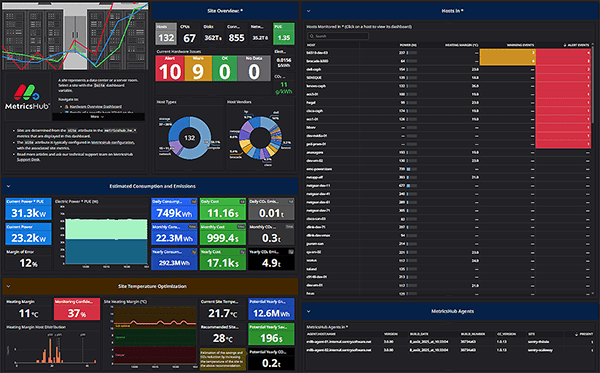
MetricsHub Hardware Site
Metrics specific to a particular site (a data center or a server room) and its monitored hosts.
 Watch it Live!
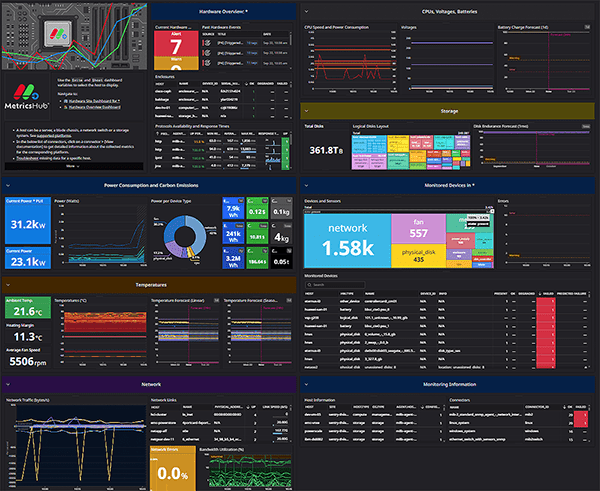
MetricsHub Hardware Host
Metrics associated with the hardware components of a physical host.
 Watch it Live!
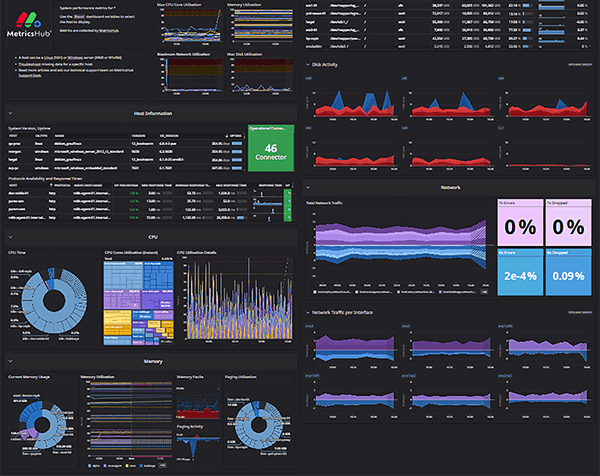
MetricsHub System Performance
System performance metrics for Linux and Windows systems, including CPU, memory, filesystems, disks, and network.
 Watch it Live!
Proactive Alerts for Critical Infrastructure Issues
Cooling & Temperature Monitoring
Detect abnormal fan speeds or overheating before component is damaged.
Agent & Connector Reliability
Be informed if a MetricsHub agent or connector stops sending data.
Power & Battery Health
Spot voltage fluctuations, overloaded power supplies, or low battery levels.
Physical Security
Monitor for intrusion events and protect the integrity of your datacenter environments.
Storage & Pathing
Ensure data availability with alerts on LUN multipathing issues or tape drive maintenance.
Hardware Lifecycle & Predictive Failure
Identify degraded, missing, or at-risk devices early.
Network Continuity
Get notified instantly when a network link goes down.
Key Features
Scalable Remote Monitoring
Monitor up to 1,000 systems from a single MetricsHub instance. No need to deploy agents on every host. Achieve faster time-to-value and simplify ongoing maintenance.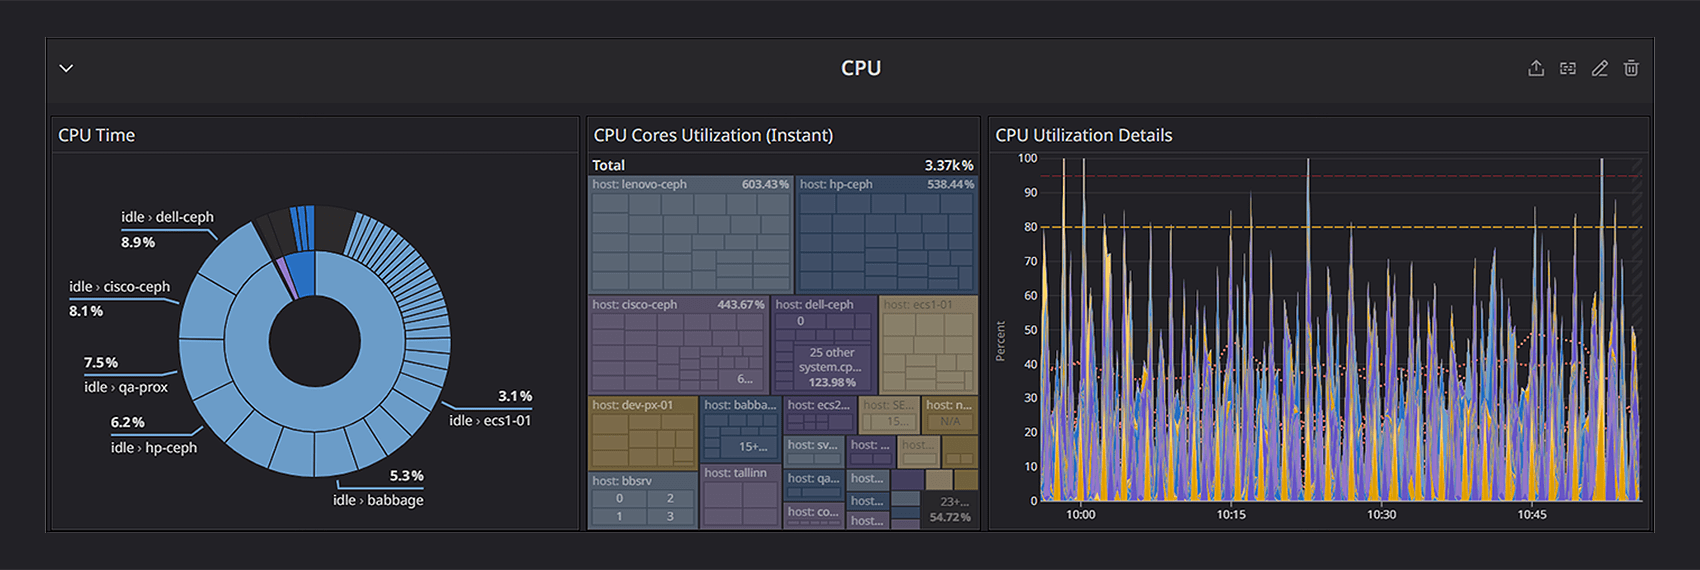
System performance monitoring
Collect key performance metrics from your Linux and Windows systems (CPU, memory, filesystems, disks, and network) to ensure optimal operations and quickly detect performance bottlenecks across your IT infrastructure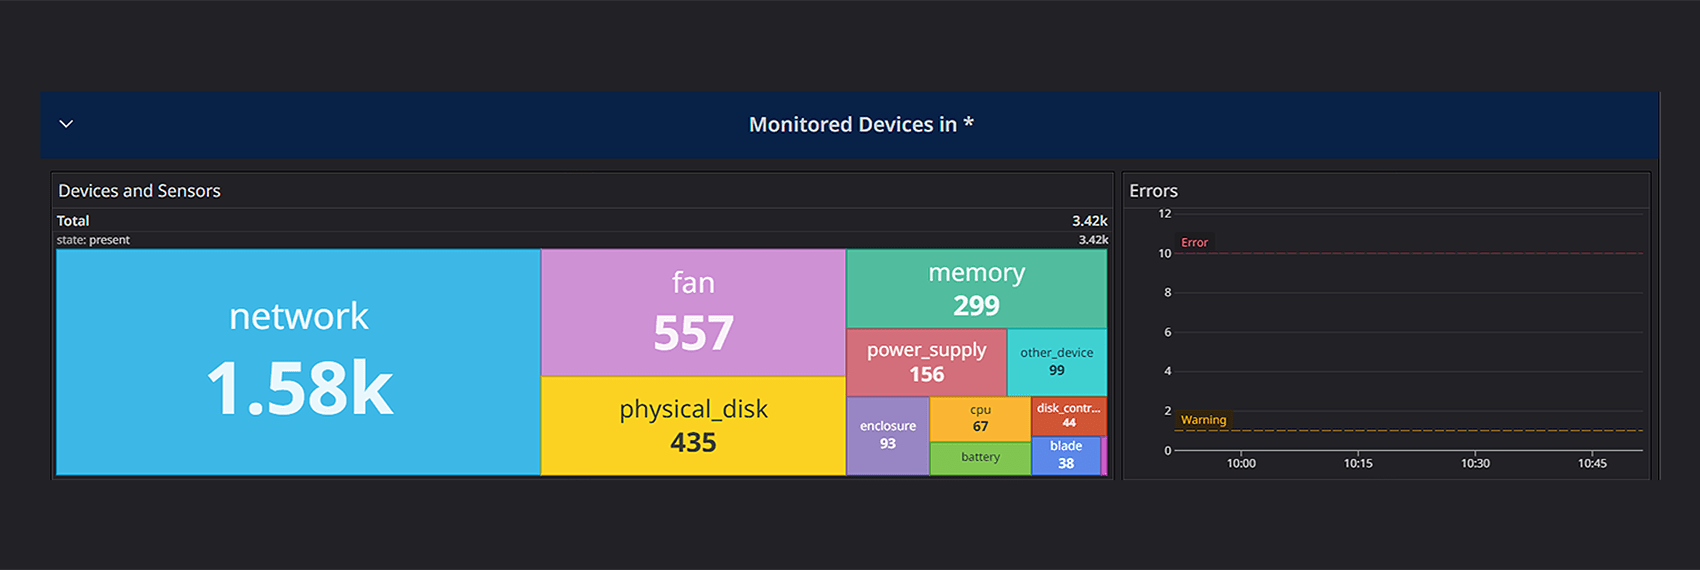
Hardware monitoring
Capture the health of your hardware assets (processors, memory modules, disks, network cards, etc.) and speed up diagnosis and troubleshooting for your on-prem IT infrastructure.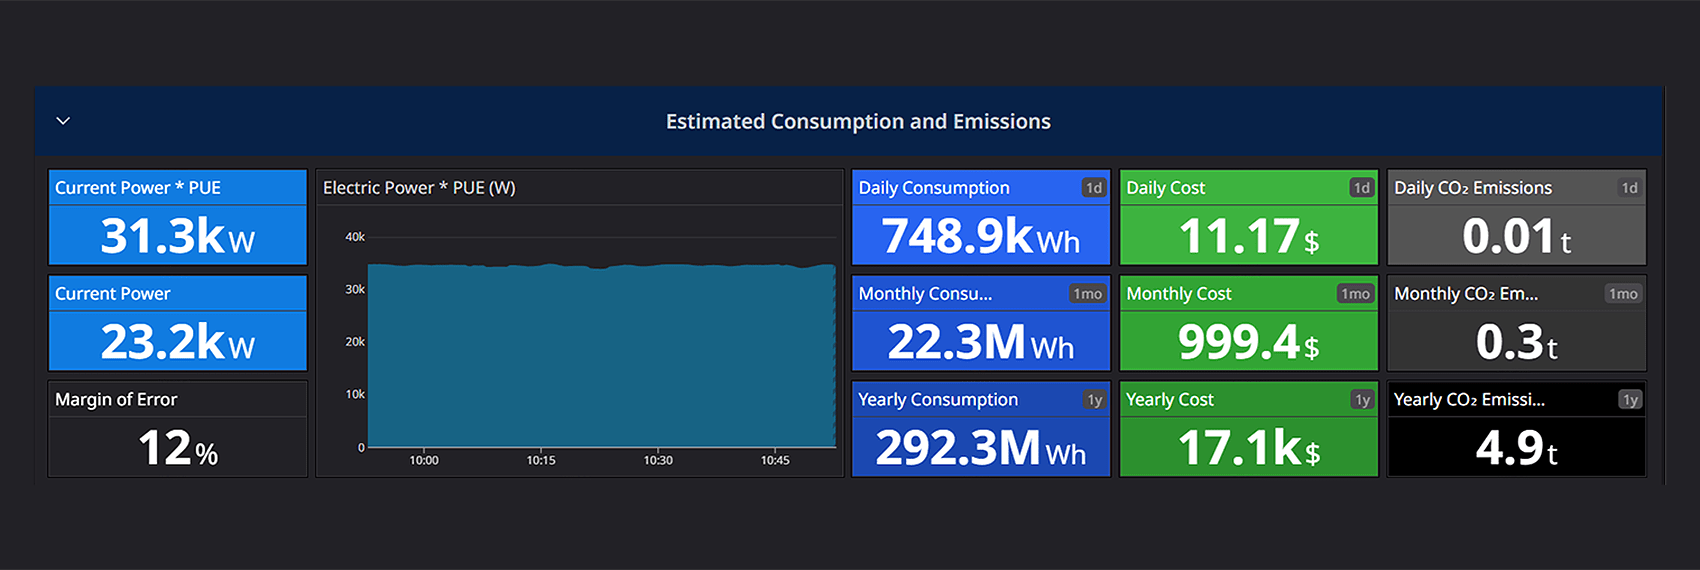
Carbon footprint reports
Track and analyze the CO₂ emissions associated with the energy usage of your data centers and provide transparency on your environmental impact with the reports issued by MetricsHub.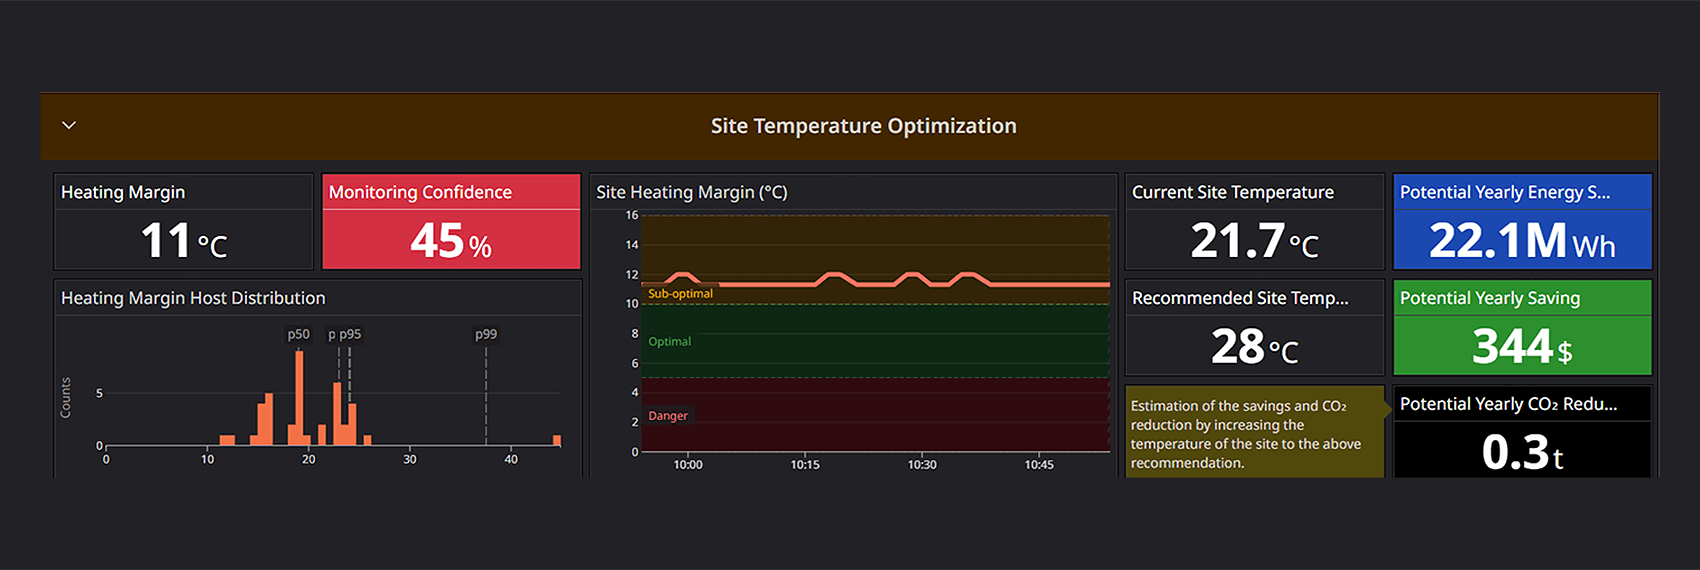
Cooling-costs optimization
Determine the proper temperature for your data centers with actual metrics and data-driven recommendations and estimate the savings that would result from raising the temperature by a few degrees.
Database Monitoring
Collect critical database metrics, such as query latency, I/O throughput, and cache efficiency, to identify bottlenecks, optimize caching, and maintain responsive applications.
Storage Monitoring
Gain visibility into the health, capacity, and performance of your storage infrastructure, including disks, volumes, and controllers. Keep track of critical indicators such as I/O activity, latency, usage, etc.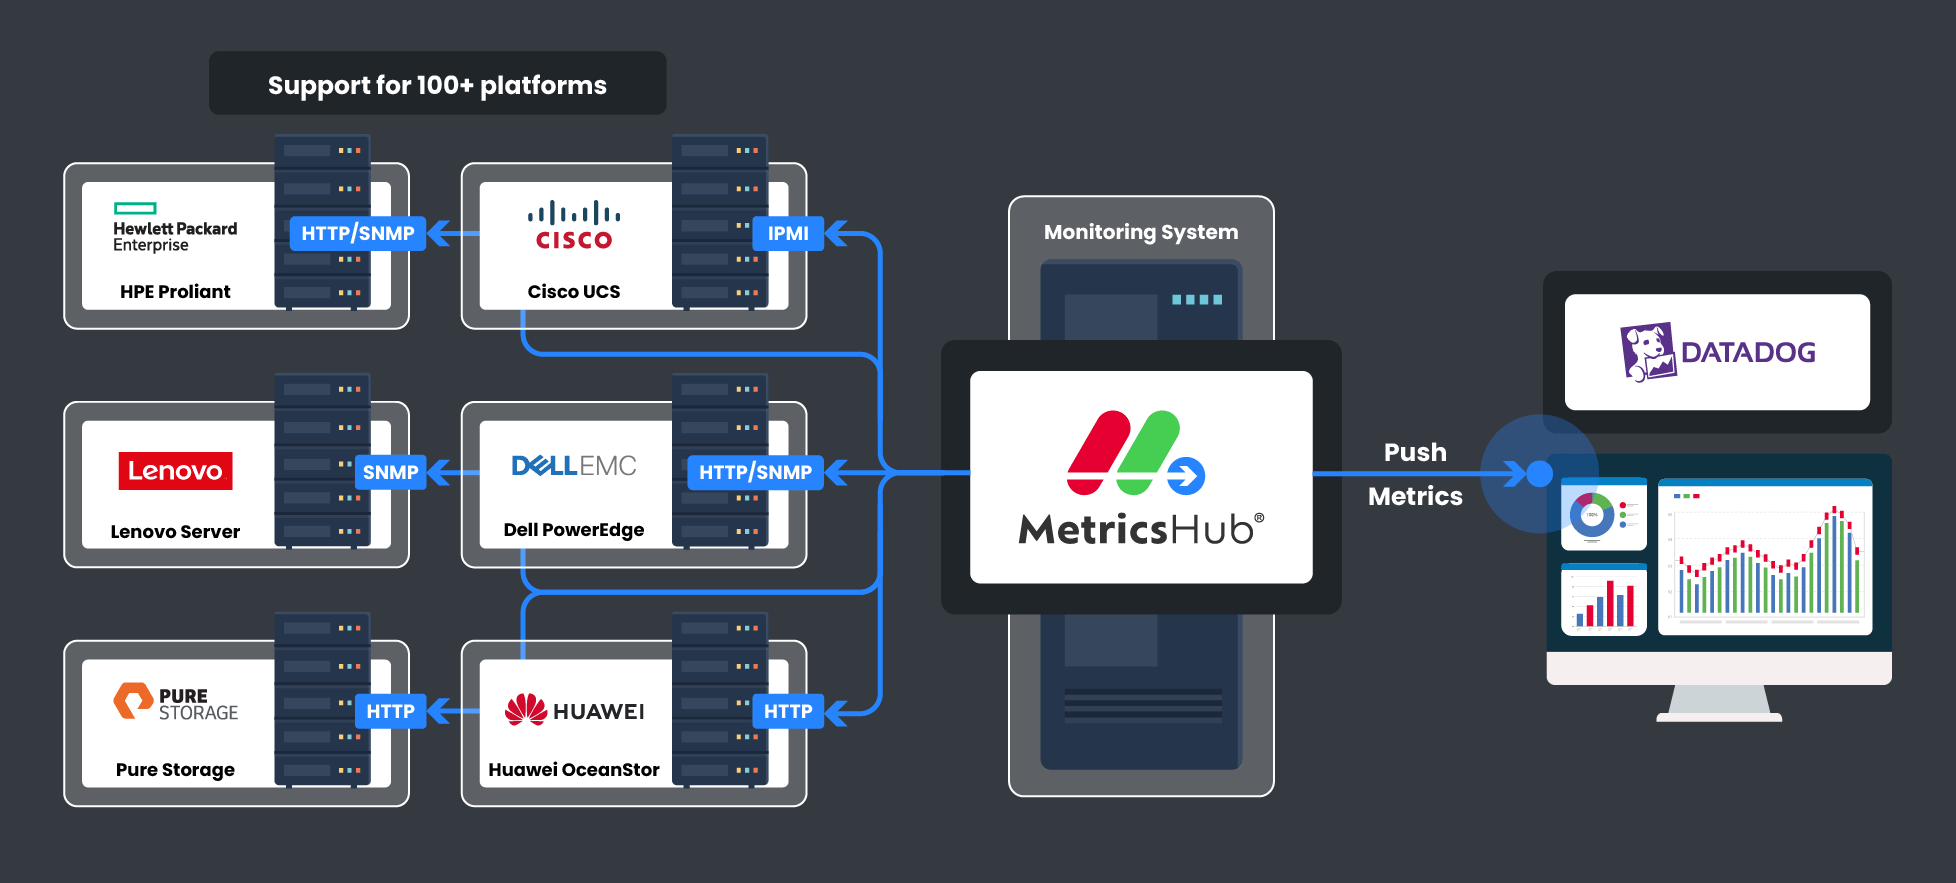
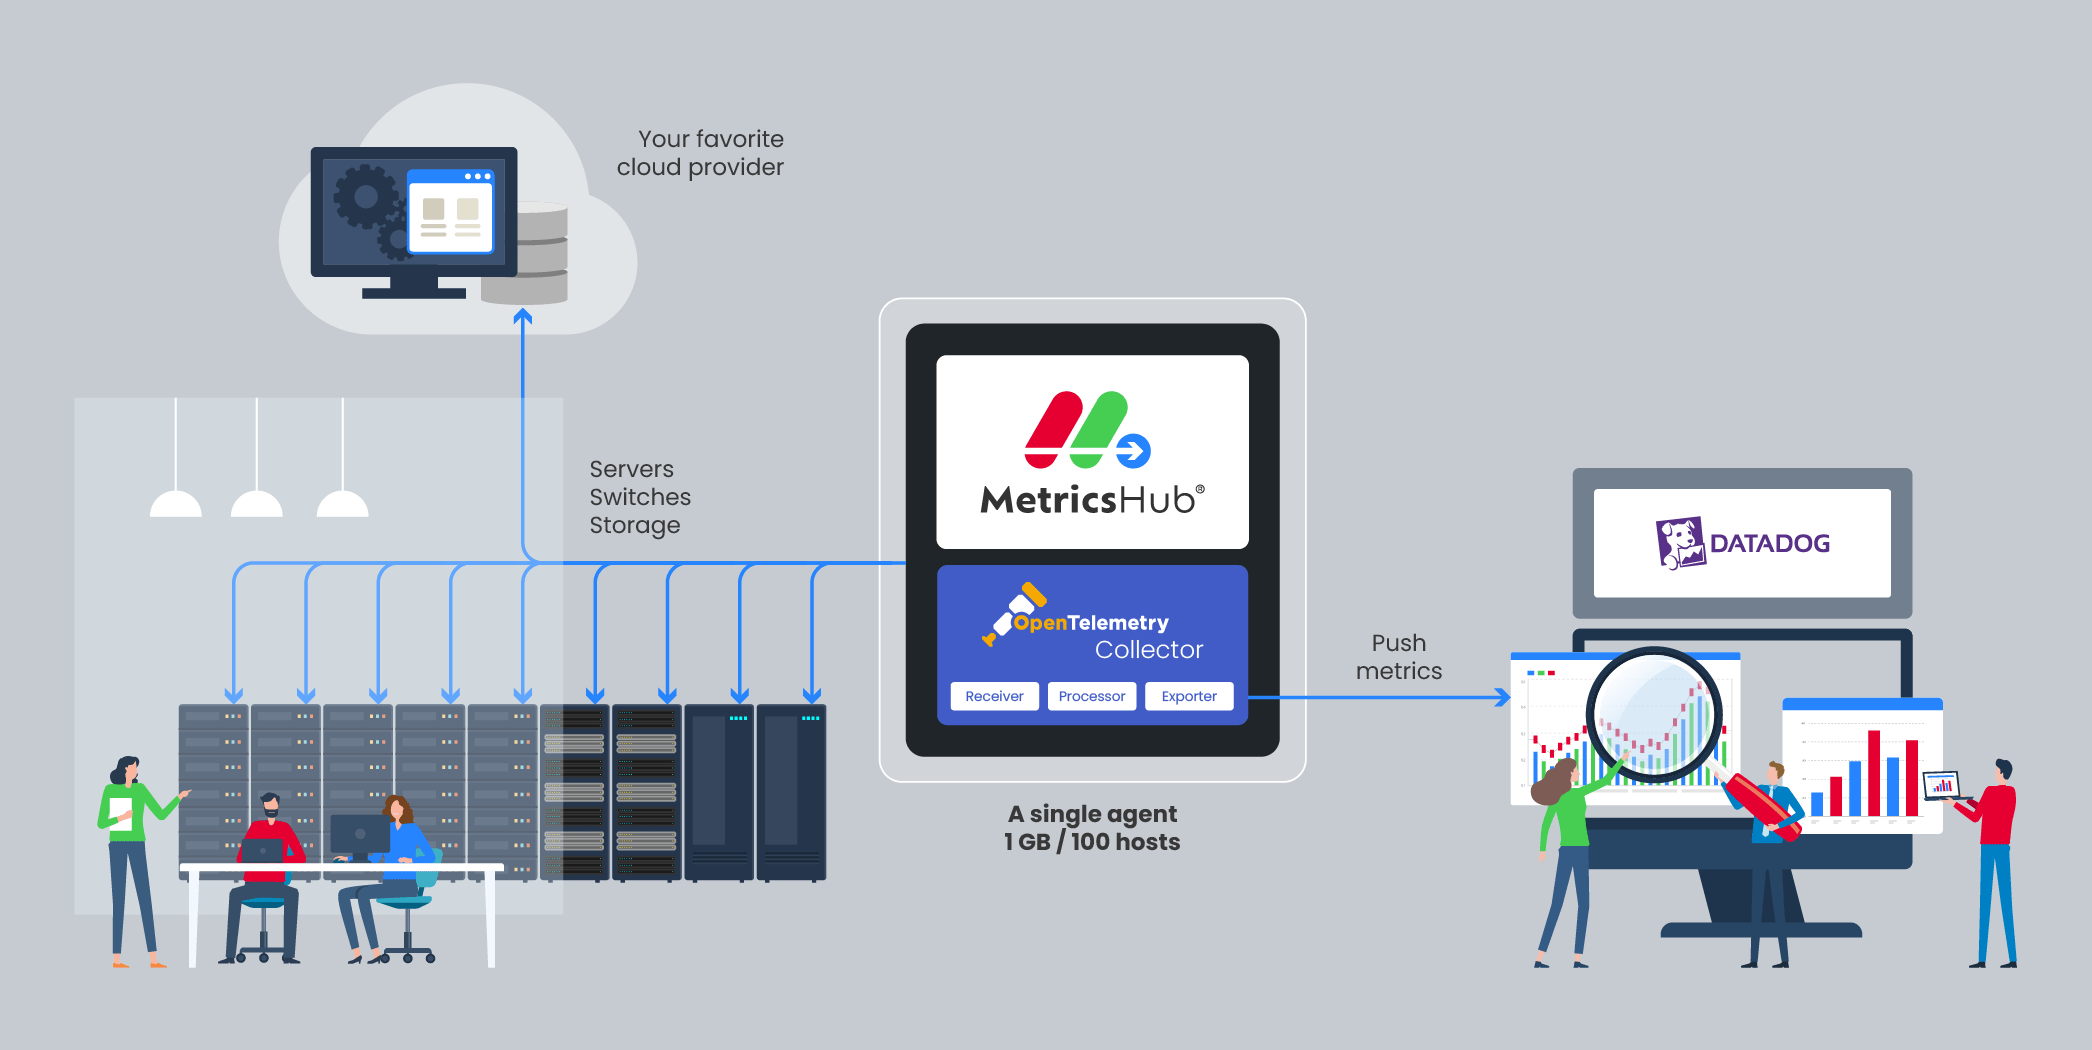
How MetricsHub Works
MetricsHub runs on-premises, collects hardware health and performance metrics from servers, switches and storage systems, and pushes them to Datadog. Metrics instantly appear in your environment for visualization, analysis, and alerting via prebuilt dashboards and monitors.
Effortless Integration in Just a Few Steps
Read the Integration Guide-
1
Subscribe to MetricsHub Enterprise
Directly from the Datadog Marketplace
-
2
Set up MetricsHub Enterprise
Install the agent, configure resource monitoring, push metrics to Datadog.
-
3
Enable Datadog Assets
Add MetricsHub Monitors, visualize data in the MetricsHub dashboards

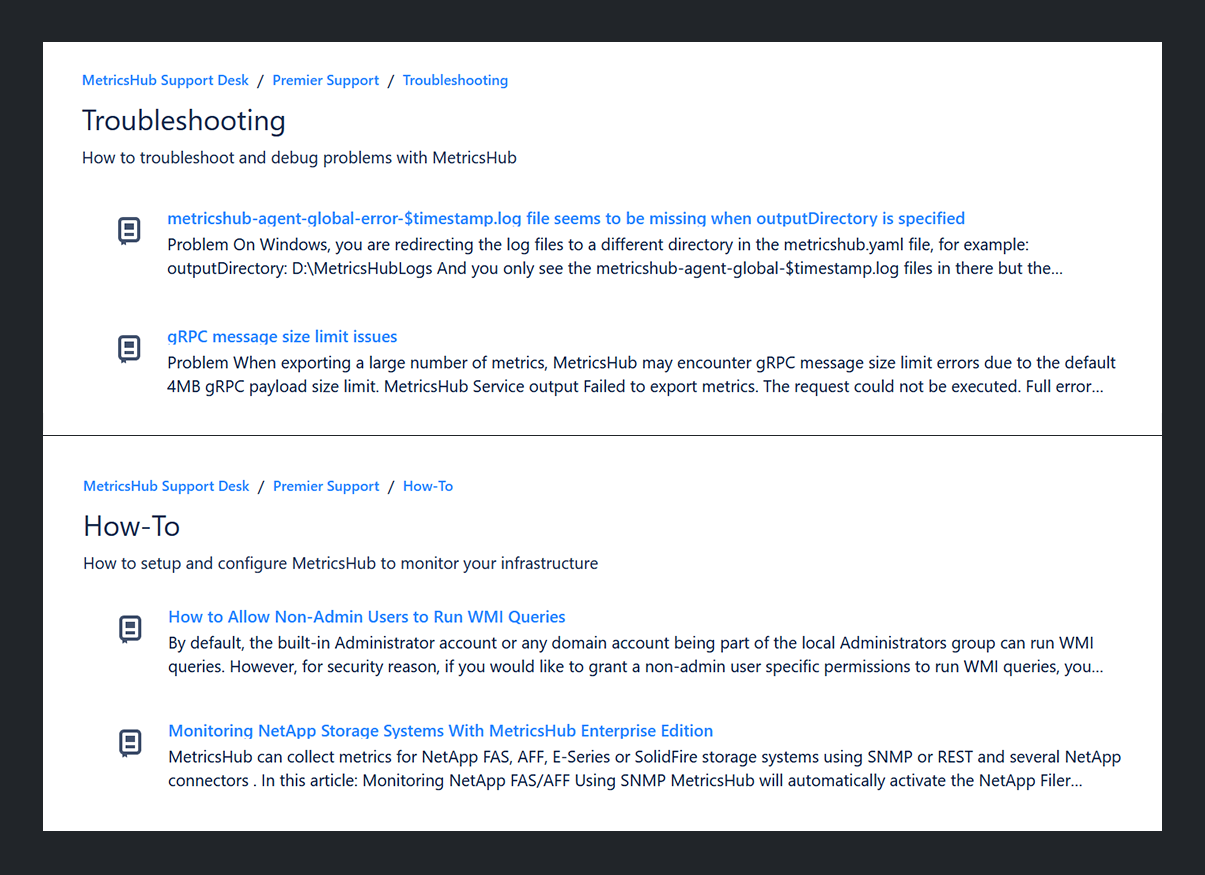
Need Help Setting up MetricsHub Enterprise?
Your subscription includes access to the MetricsHub Support Desk, our premium support service. Our experts are here to ensure a smooth deployment, from installation to advanced configuration. Whether you face an unexpected roadblock or just need best-practice guidance, we've got you covered.
About MetricsHub Support Desk Access Support DeskAdditional Resources
Solution Brochure
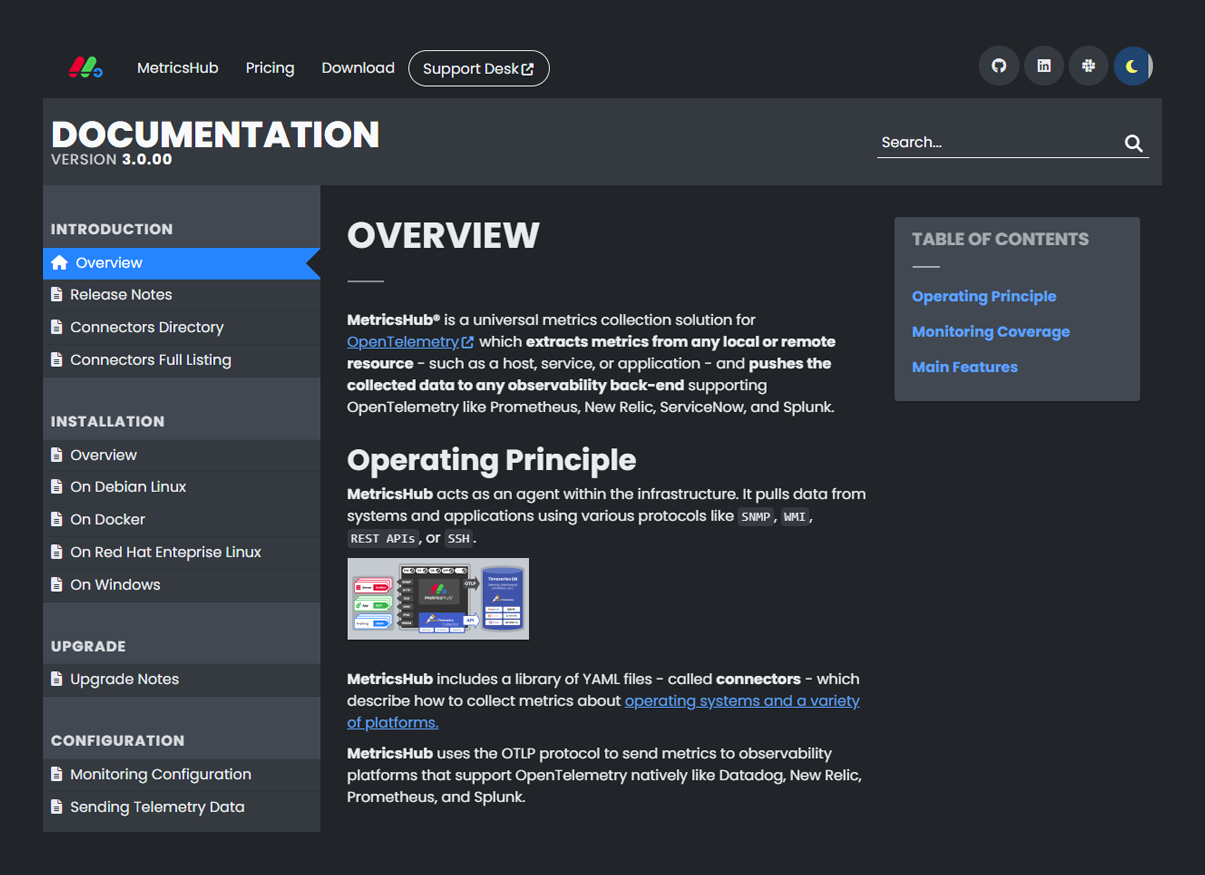
Documentation
Knowledge Base
Ready to Get Started?
See MetricsHub in Action
Request a tailored demo or proof of concept and experience its capabilities in your unique environment.
Request a DemoHave Questions?
Need additional information to enhance your current Datadog setup? Our team is only one message away to assist you.
Contact Us