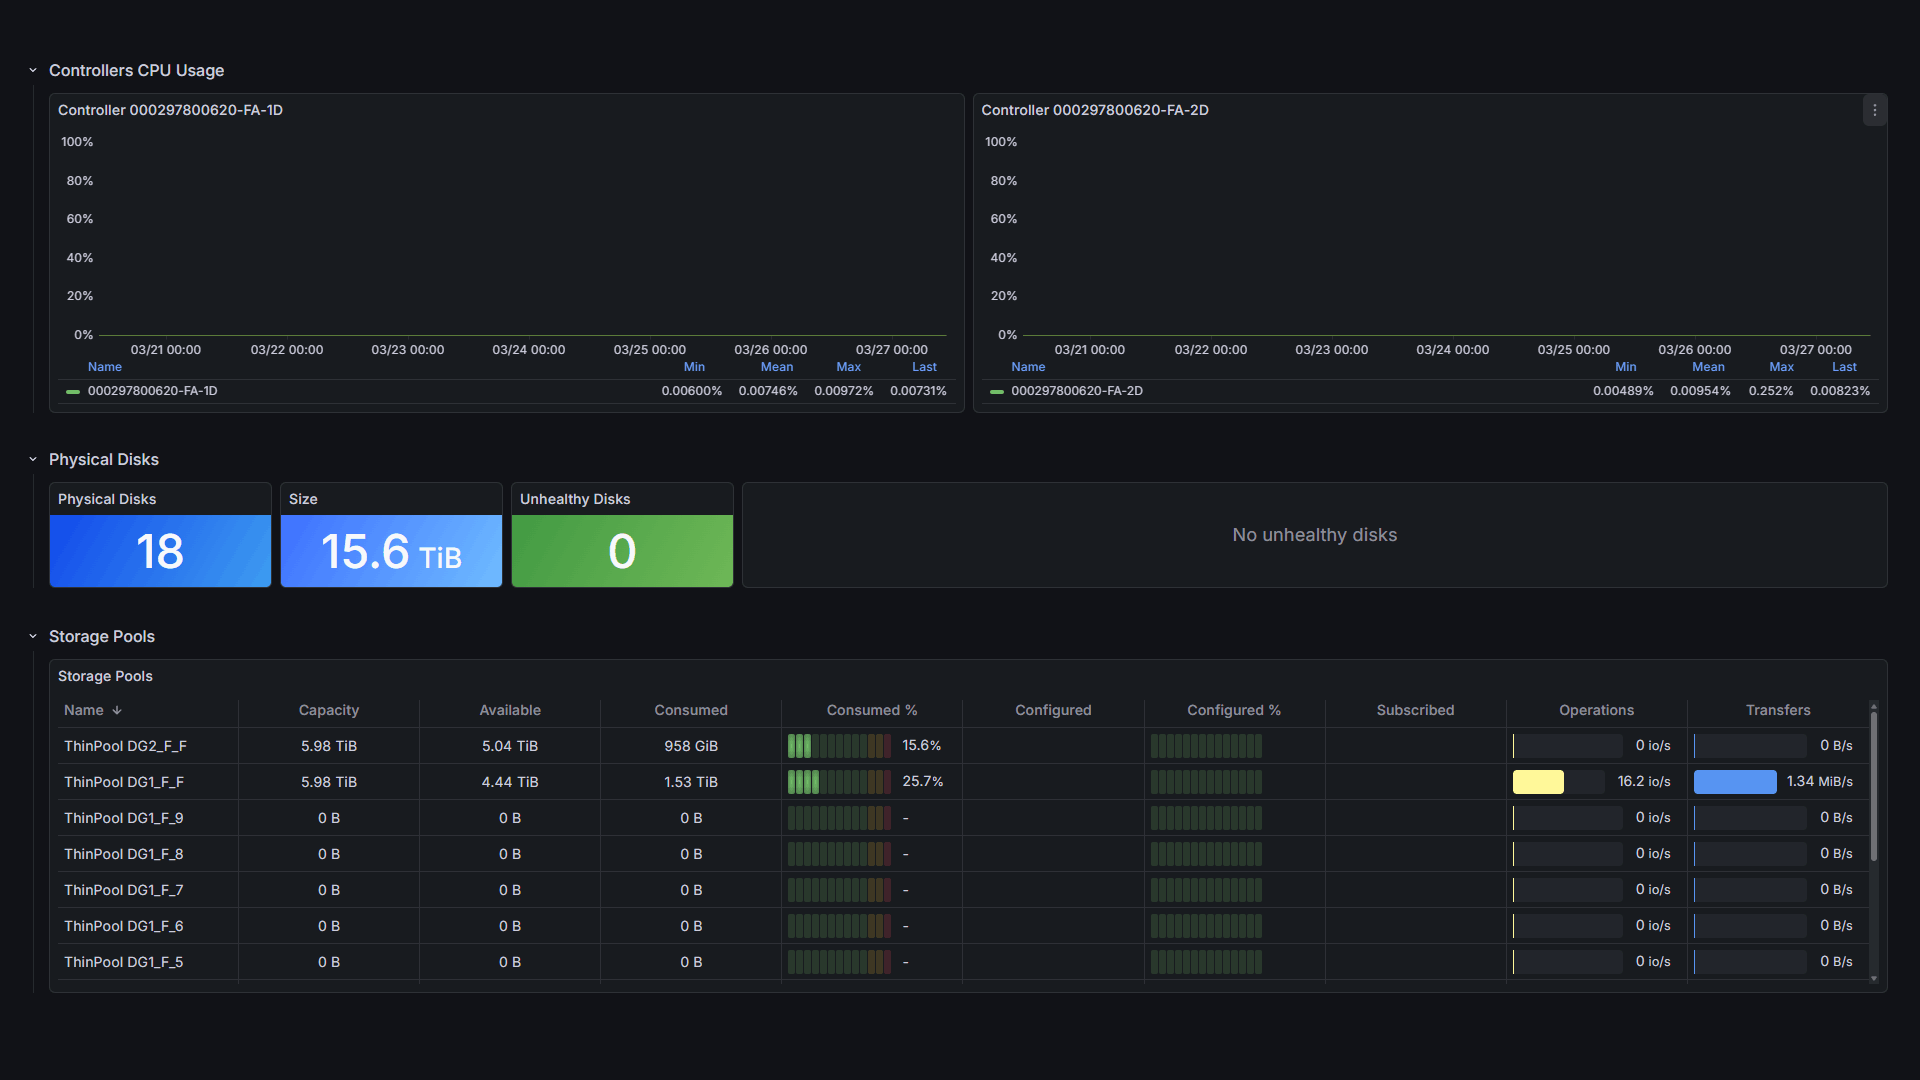
Comprehensive Infrastructure Monitoring in BMC Helix
MetricsHub delivers deep, real-time insights into your infrastructure directly within BMC Helix. Monitor hardware health, system performance, and sustainability metrics across servers, storage, and network devices, so you can anticipate issues, control costs, and improve the efficiency of your data centers.


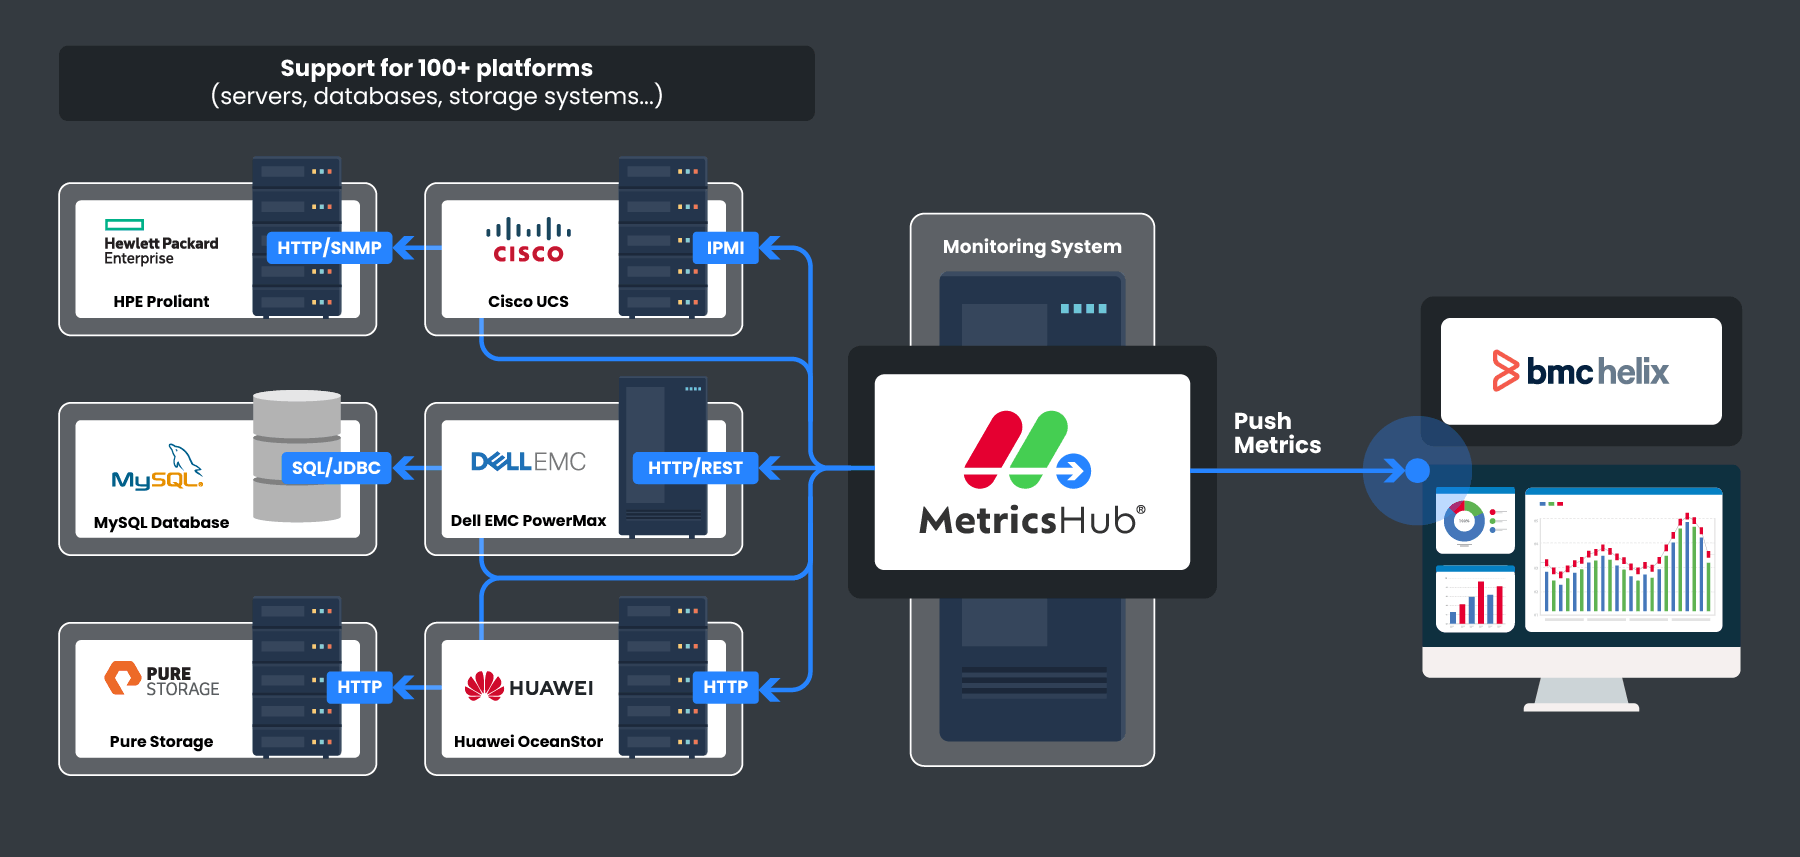
Unified Coverage Across 100+ Platforms
With over 250 prebuilt connectors, MetricsHub extends BMC Helix's visibility across a wide range of technologies:
- Servers: Dell PowerEdge, Cisco UCS, Fujitsu PRIMERGY, HPE ProLiant, Lenovo ThinkSystem, IBM POWER, SuperMicro, and many more.
- Systems & Hypervisors: Linux, Microsoft Windows, VMware, Proxmox.
- Storage Systems: NetApp, Dell EMC, Hitachi, HPE 3PAR, Huawei OceanStor, IBM FlashSystem, Pure Storage, Synology, and more.
- Network Devices: Cisco, Juniper, Arista, F5, HPE Aruba, Extreme Networks, and any MIB-2 compliant device.
- Databases: Microsoft SQL Server, MySQL, PostgreSQL, Oracle Database.
- Other Devices: APC, Citrix NetScaler, Eaton, Raritan
Ready-to-Use Alarm Policies for BMC Helix
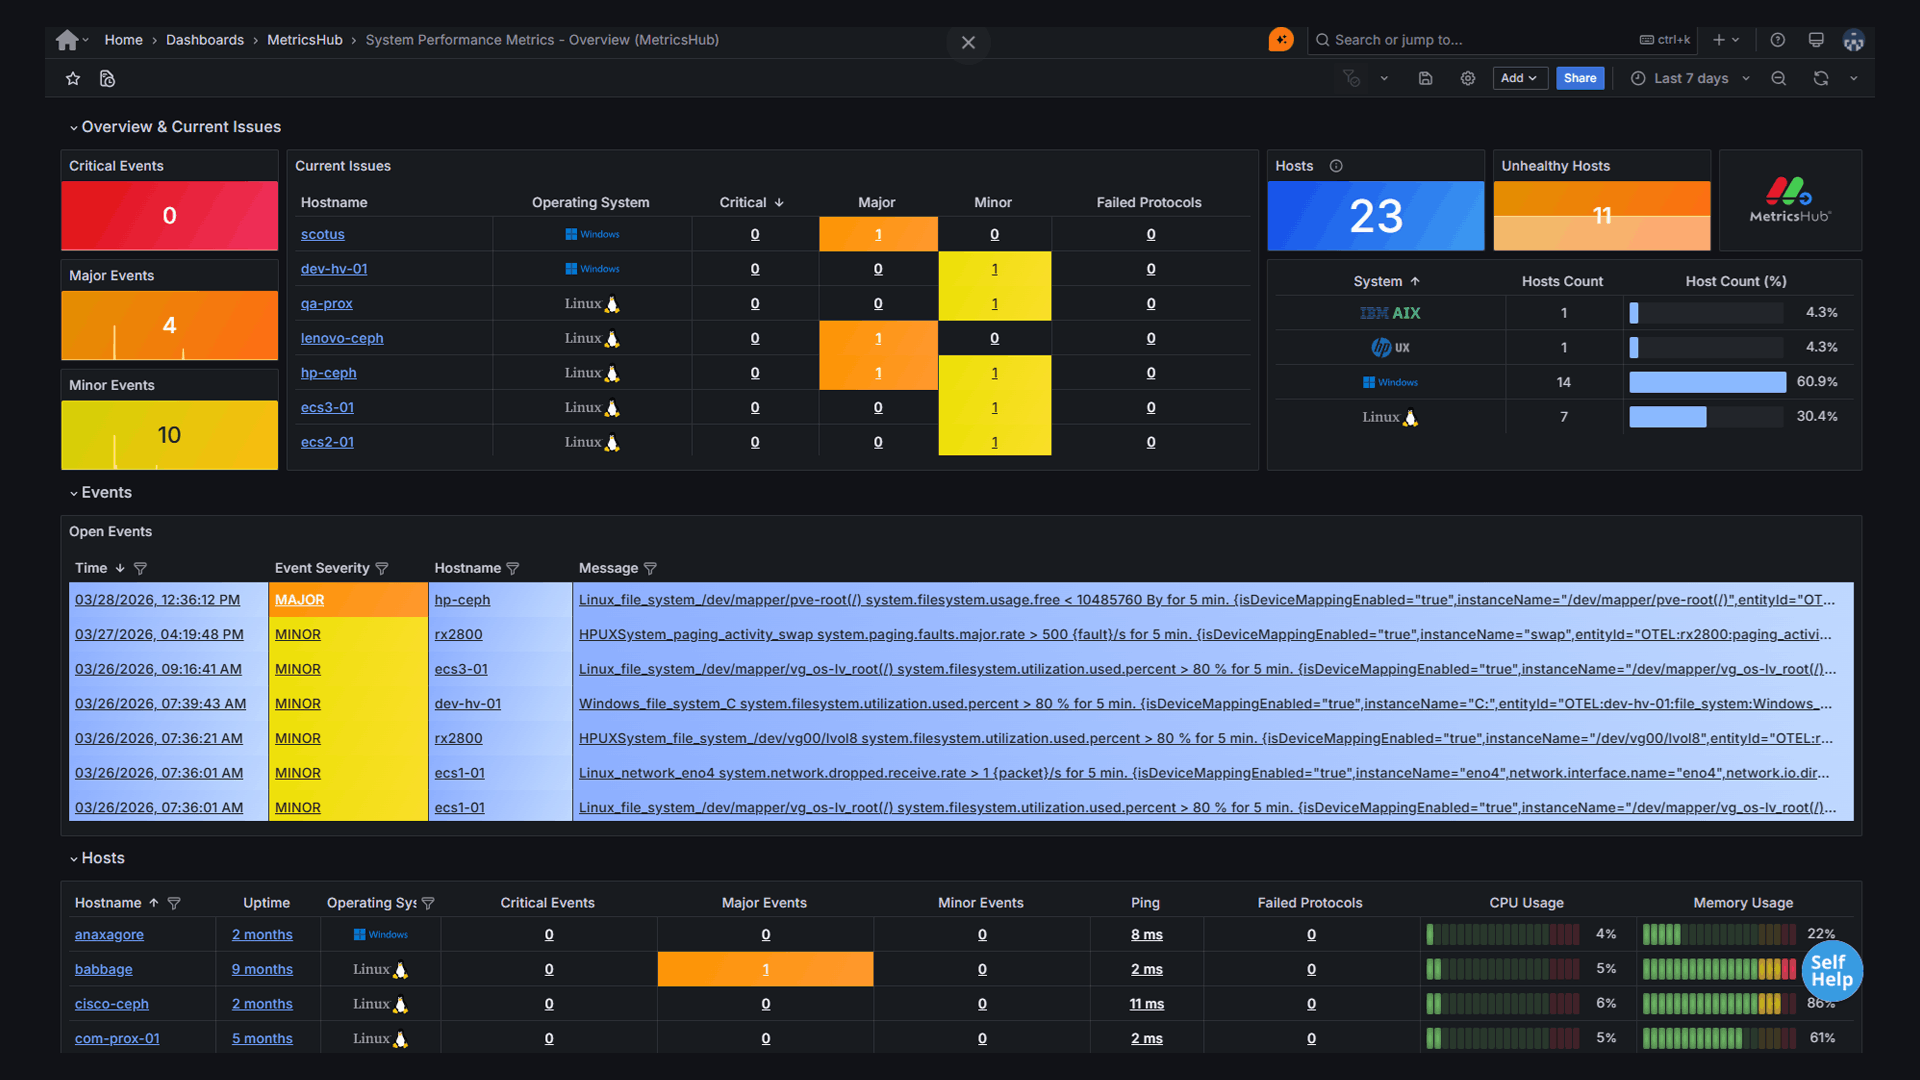
System Performance & Resource Usage
Detect abnormal filesystem, memory, and network behavior, including disk saturation, low available memory, packet drops, network errors, and excessive paging activity.Hardware Health & Availability
Be immediately alerted when hardware components are missing, degraded, or failing across compute, memory, storage devices, fans, power supplies, and other infrastructure components.Predictive Failure & Device Reliability
Anticipate issues before they occur with early warnings on components at risk of failure, such as CPUs or disks reporting predictive failure, increasing error rates, or low remaining endurance.Cooling & Environmental Monitoring
Identify cooling and environmental issues by detecting degraded or failed fans, low fan speed, and abnormal temperature or voltage conditions.Storage Health & Capacity
Ensure storage reliability by monitoring degraded or failed disks, controllers, and logical disks, as well as LUN path availability and disk health indicators.Network Connectivity & Errors
Get notified when network interfaces are down, not operating correctly, or experiencing abnormal error ratesPower Supply & Battery Health
Detect power-related issues early, including failed or degraded power supplies, missing components, and batteries with low or critical charge levels.MetricsHub Connector Reliability
Be informed immediately if a MetricsHub connector fails, ensuring continuous visibility of your monitored infrastructure.Key Features
Scalable Remote Monitoring
Monitor up to 1,000 systems from a single MetricsHub instance. Eliminate manual setup with fully automated provisioning and programmable configuration.
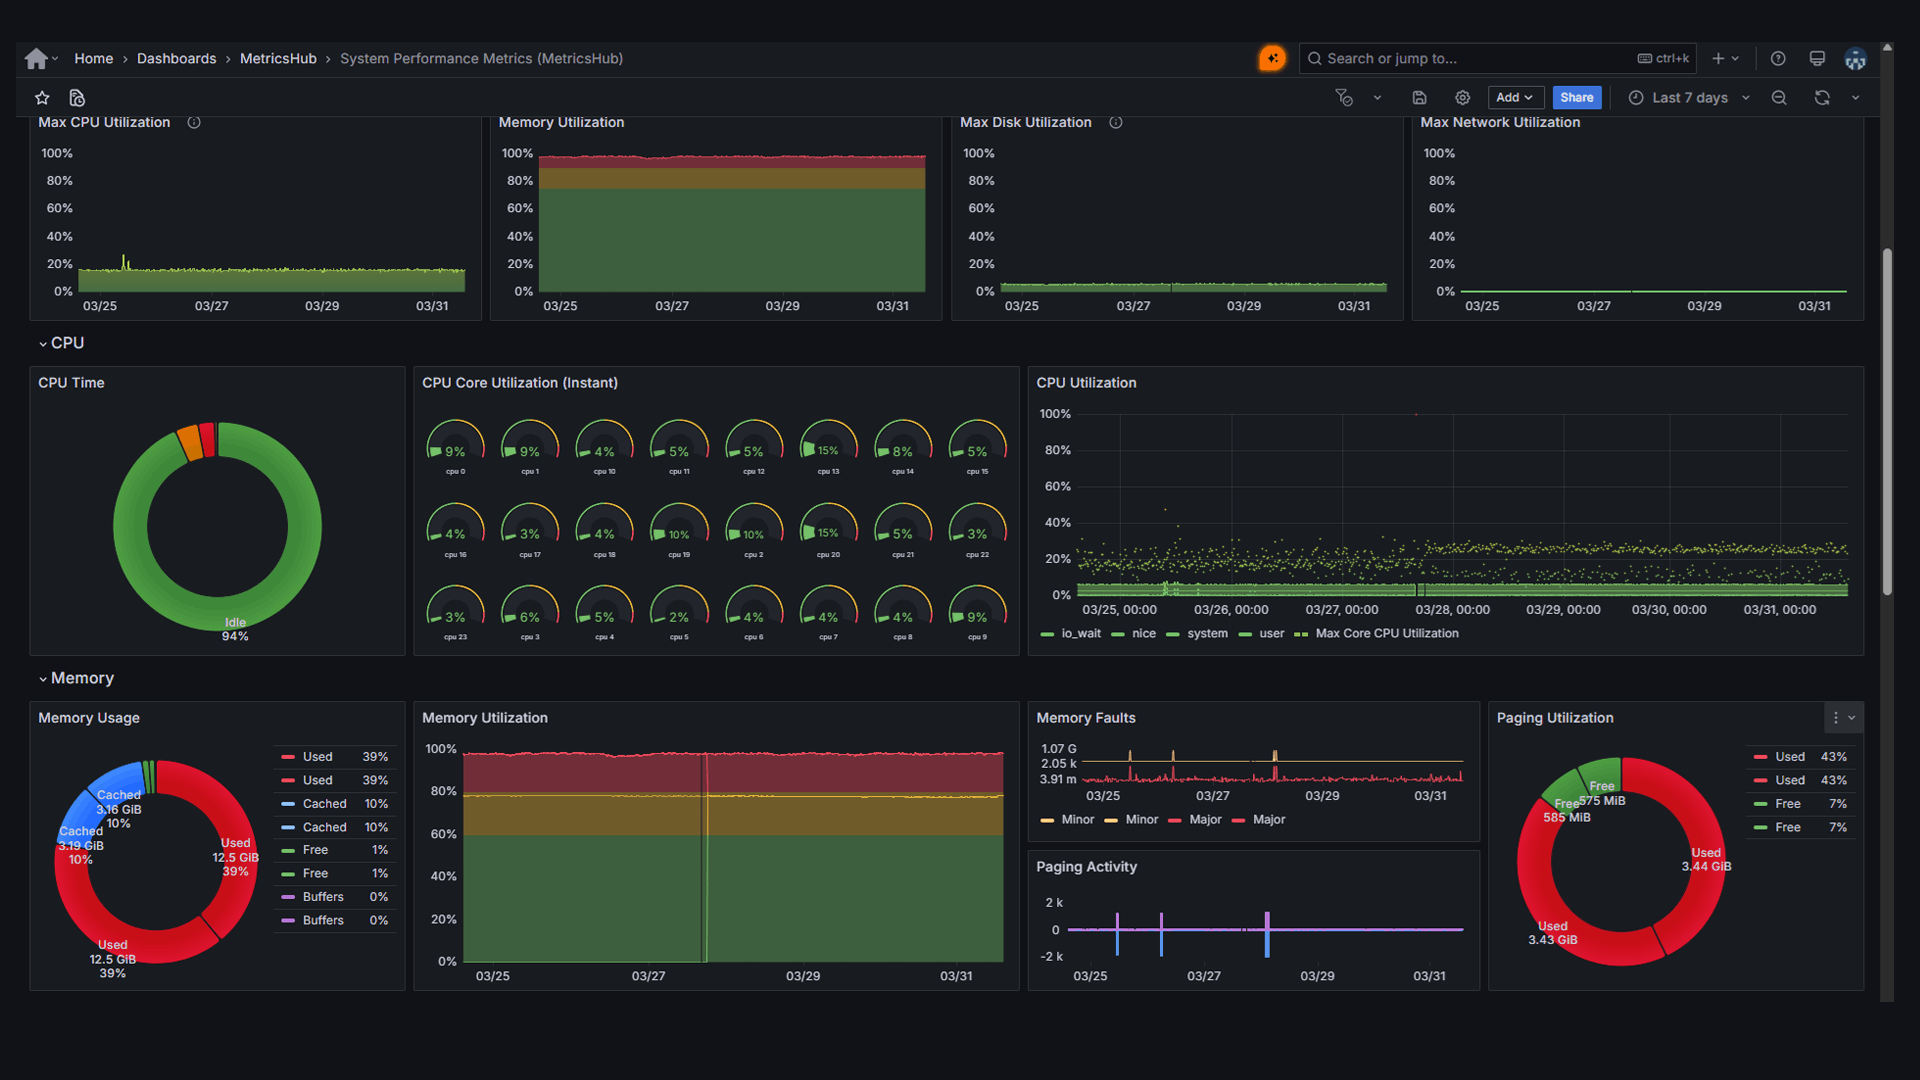
System Performance Monitoring
Track CPU, memory, filesystem, disk, and network performance on Linux and Windows to detect bottlenecks early and maintain smooth operations.
Hardware monitoring
Detect and predict failures in processors, memory modules, disks, network cards, controllers, power supplies, fans, temperature sensors, and more.
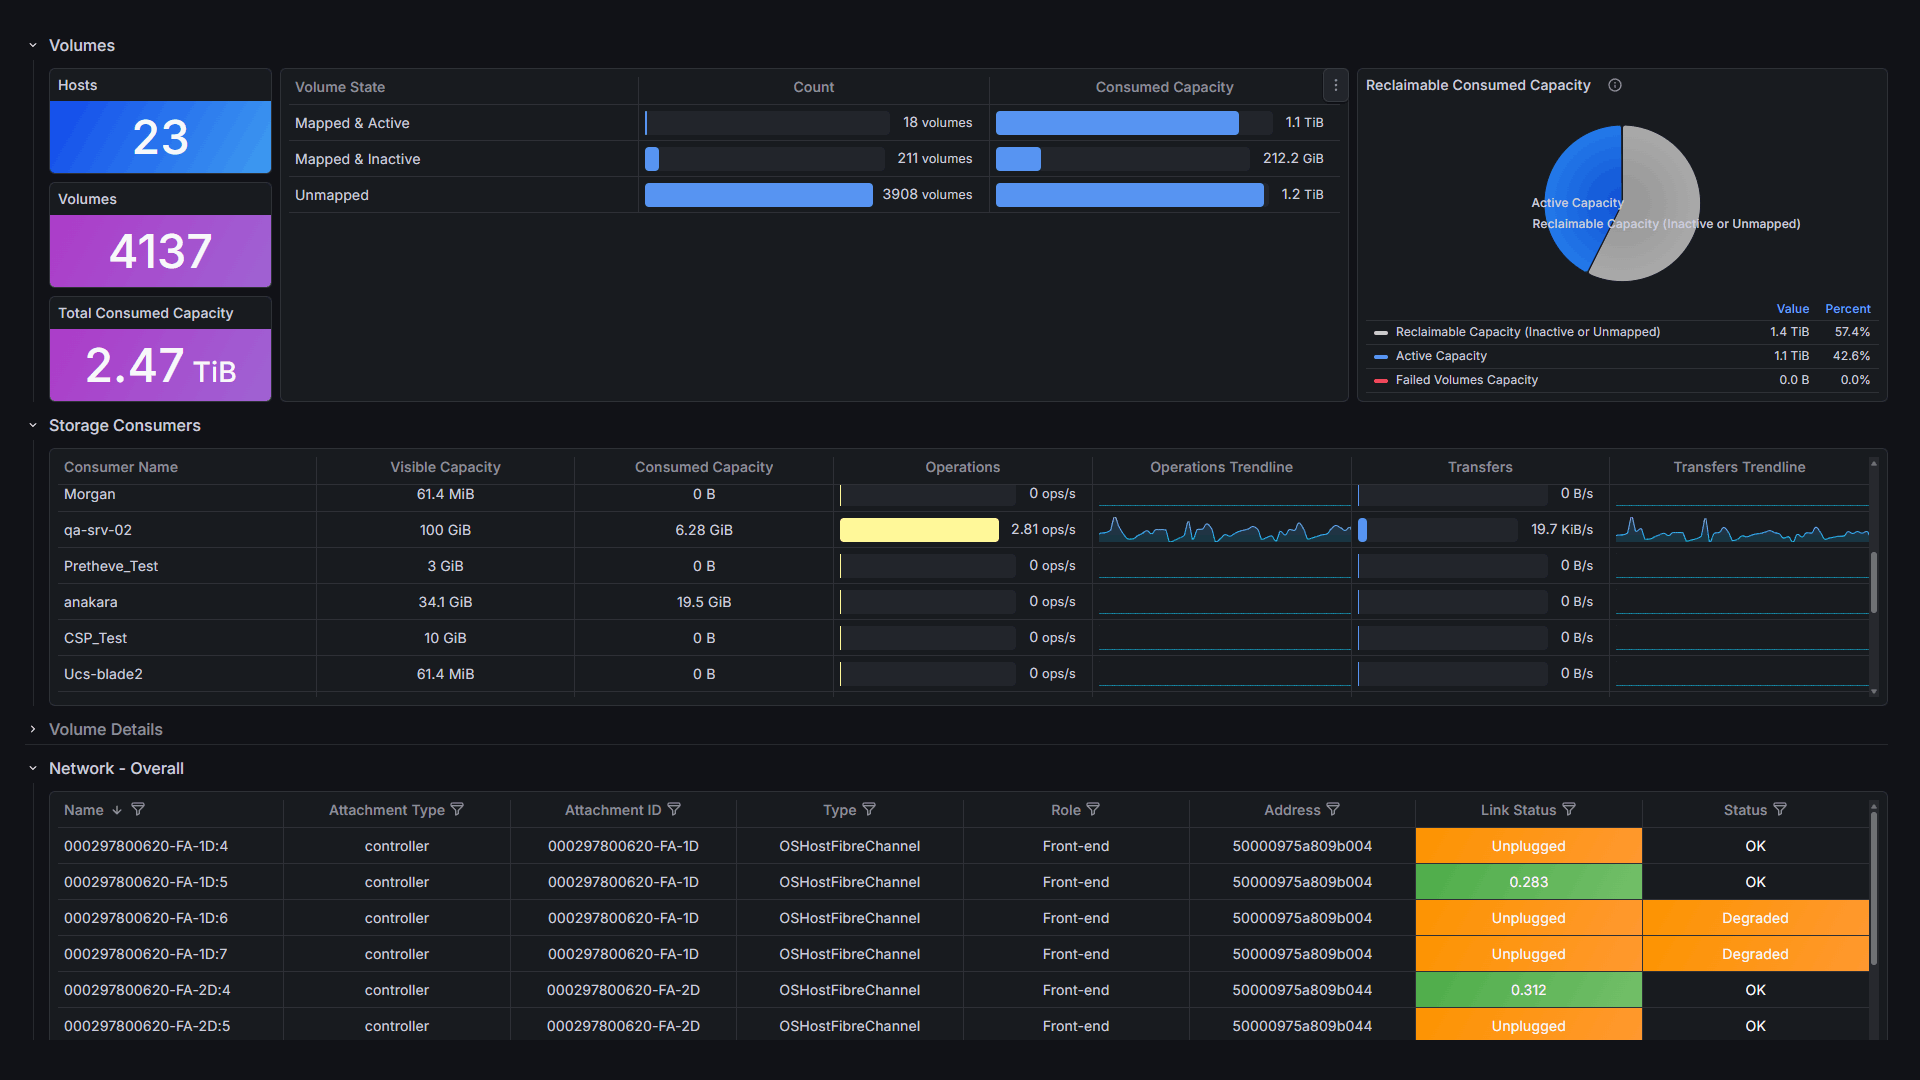
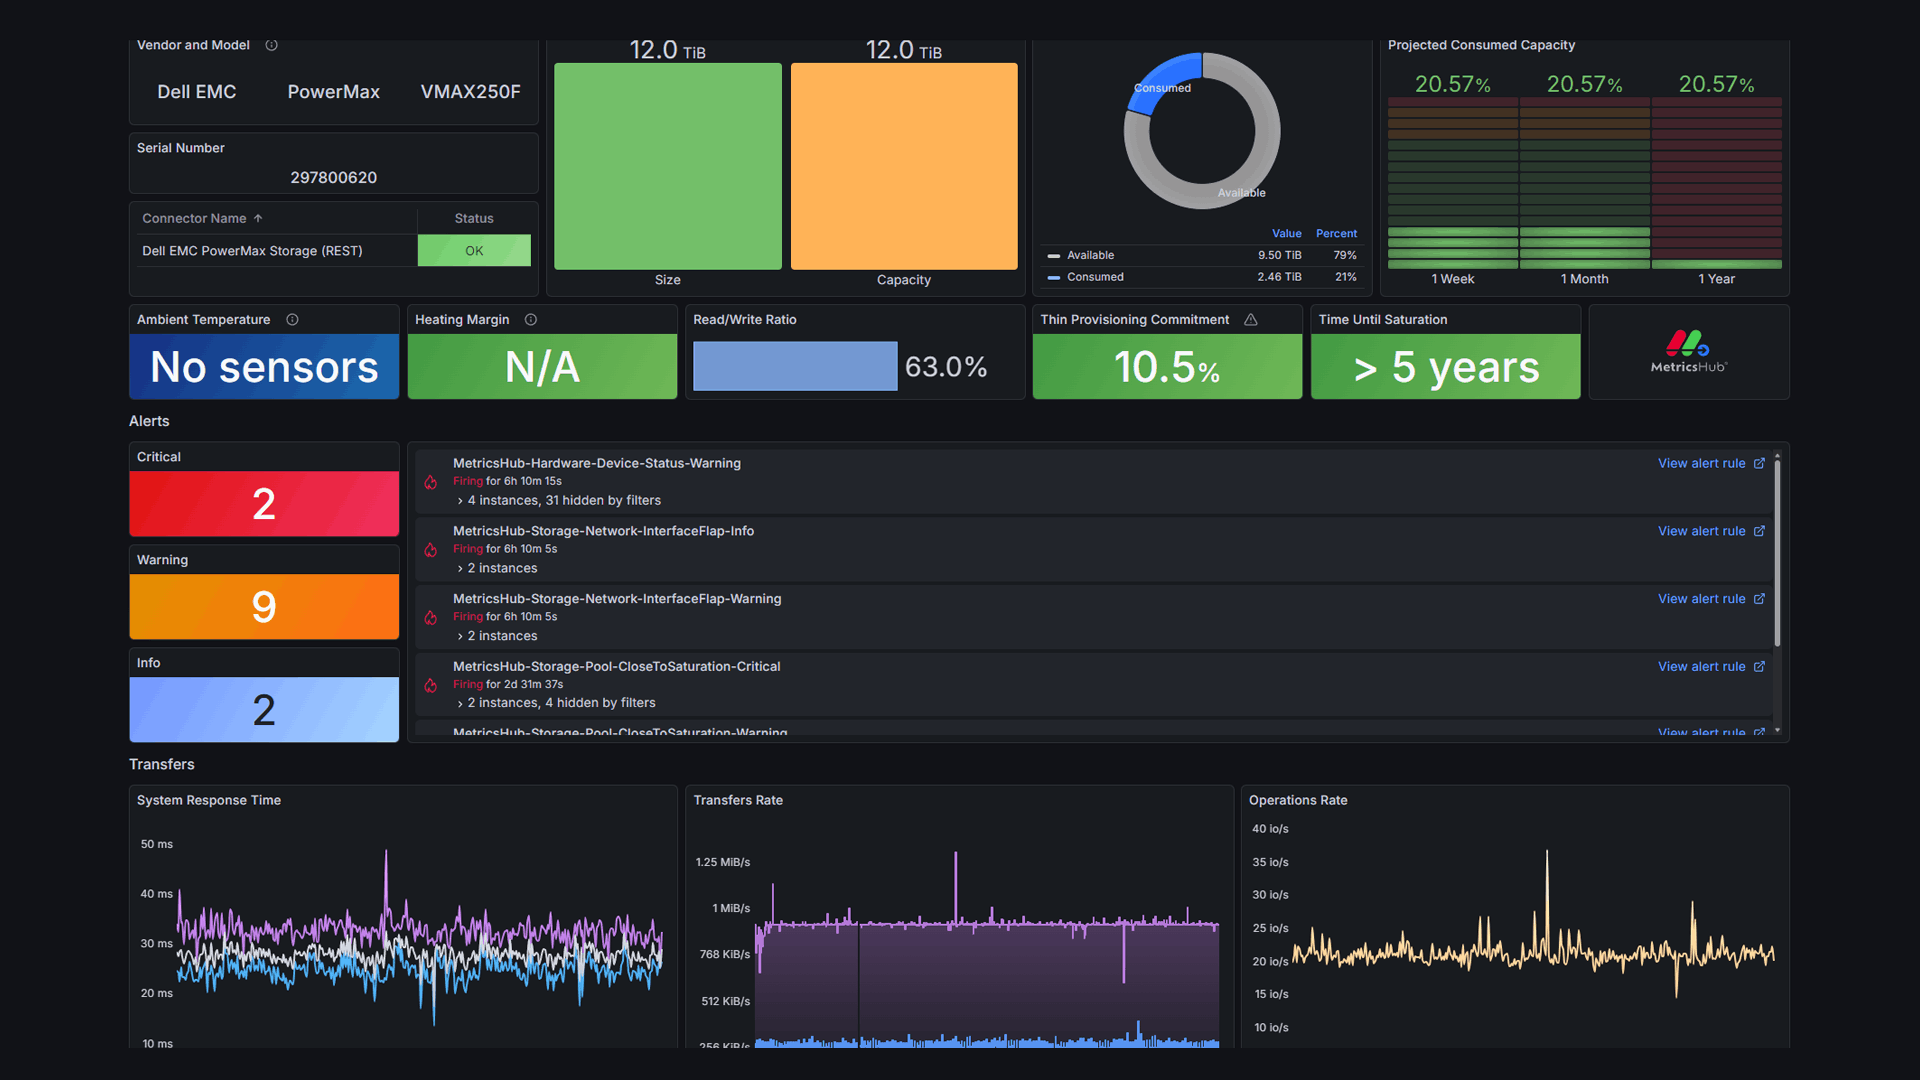
Storage Monitoring
Monitor health, capacity, and performance across disks, volumes, and controllers. Track I/O, latency, usage, endurance, and environmental data.
Database Monitoring
Observe query latency, I/O performance, cache efficiency, connection counts, memory usage, and error rates to optimize responsiveness.
Sustainability Insights
Track electricity usage and CO₂ emissions across your IT infrastructure. Optimize data center temperature to cut energy costs and reduce your environmental footprint.
Extensible Monitoring
Collect custom metrics through standard protocols (SNMP, SSH, WBEM, WMI, and more) to easily extend coverage to your specific cases.
AI Enabler
Connect any LLM to real-time infrastructure metrics through the MetricsHub MCP Server to assist administrators in problem resolution.
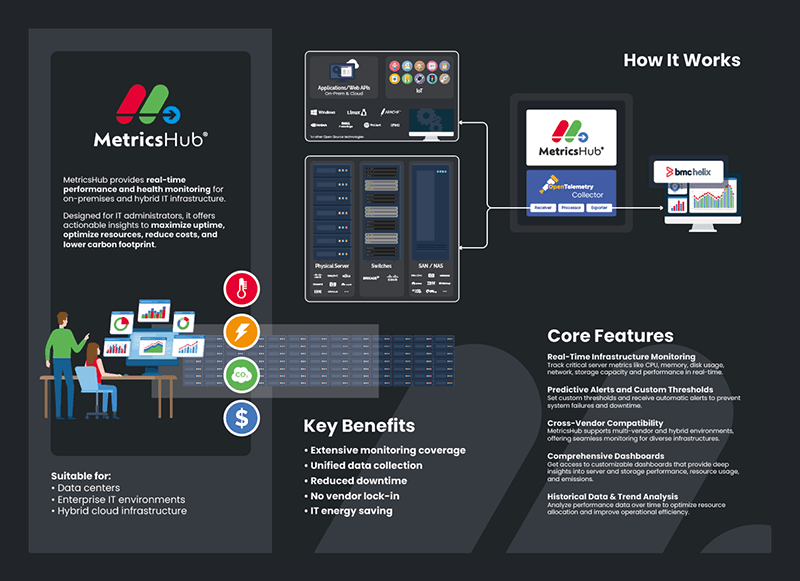
How MetricsHub Works
MetricsHub collects detailed health and performance metrics across your infrastructure, covering servers, storage systems, databases, and network devices, and pushes them to BMC Helix through the BMC Helix Exporter.
Effortless Integration in Just a Few Steps
Read the Integration Guide-
1
Install MetricsHub
Fast setup with installable packages for RedHat, Docker, and Windows.
-
2
Configure Resource Monitoring
Comprehensive coverage of servers, storage, networks, databases, and services.
-
3
Configure Integration
Create an authentication key, configure the BMC Helix Exporter, and transform metrics.

Need Help Setting up MetricsHub Enterprise?
Your subscription includes access to the MetricsHub Support Desk, our premium support service. Our experts are here to ensure a smooth deployment, from installation to advanced configuration. Whether you face an unexpected roadblock or just need best-practice guidance, we've got you covered.
About MetricsHub Support Desk Access Support DeskAdditional Resources
Solution Brochure
Documentation
Knowledge Base
Ready to Get Started?
See MetricsHub in Action
Request a tailored demo or proof of concept and experience its capabilities in your unique environment.
Request a DemoTake BMC Helix to the Next Level
Bring on-prem observability to BMC Helix with MetricsHub Enterprise.
Try It FreeHave Questions?
Need additional information to enhance your current BMC Helix setup? Our team is only one message away to assist you.
Contact Us