MetricsHub
Documentation 0.9.02
-
Home
- Troubleshooting
MetricsHub CLI (metricshub)
Overview
The metricshub CLI is the core MetricsHub's engine wrapped in a command line interface. System administrators can easily invoke this tool in a shell to discover and report problems related to the specified resources, including hardware, systems, applications, services, etc.
The detailed list of systems supported by the MetricsHub community (manufacturer and product family and the required instrumentation stack) is listed in Community Connectors Library[1].
The quantity and quality of the information that MetricsHub will gather depends on the instrumentation stack available on the targeted resource (host).

Only a few options are required to run the metricshub command:
- Hostname or IP address of the device to be monitored
- Device type
- Protocols to be used:
- HTTP
- IPMI-over-LAN
- SSH
- SNMP
- WBEM
- WMI (on Windows only)
- Credentials

The metricshub command can be used to troubleshoot the monitoring performed by the MetricsHub Agent (the core engine).
The Basics
The metricshub command invokes the MetricsHub Engine against one resource and performs 3 tasks:
- Detection of the instrumentation stack on the targeted resource (host)
- Discovery of the resource's components
- Collection of metrics and status for each resource's component
The metricshub command requires a few parameters to run:
- the hostname to connect to
- the type of the resource (Windows, Linux, Management, Storage, Network, AIX, HP-UX, Solaris)
- the protocols to use to gather information from the resource (HTTP, IPMI, SNMP, SSH, WBEM or WMI)
- the credentials
Example:
$ metricshub server01 -t win --snmp 1 --community secret
The above command will connect to server01 (a Windows system), and will detect which instrumentation stack responds to SNMP version 1 with the secret community.
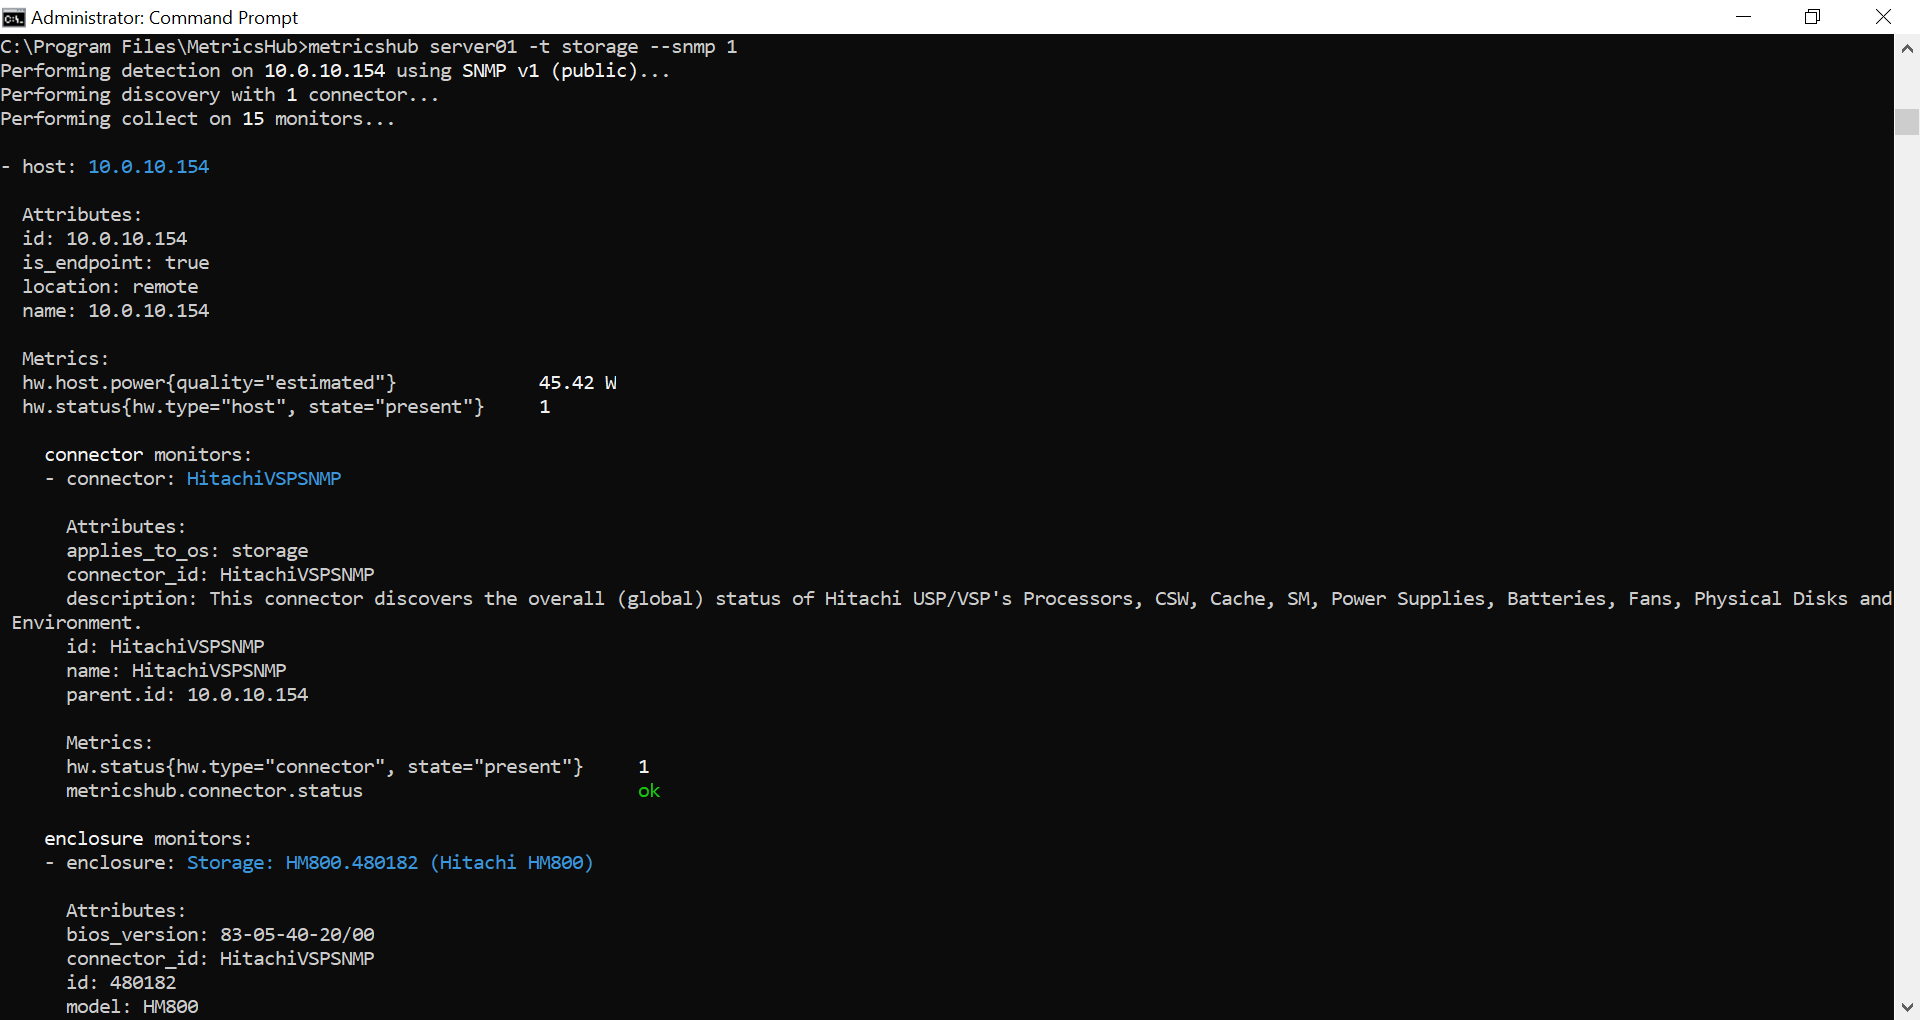
Assuming server01 is an Hitachi server, the metricshub output will look like:

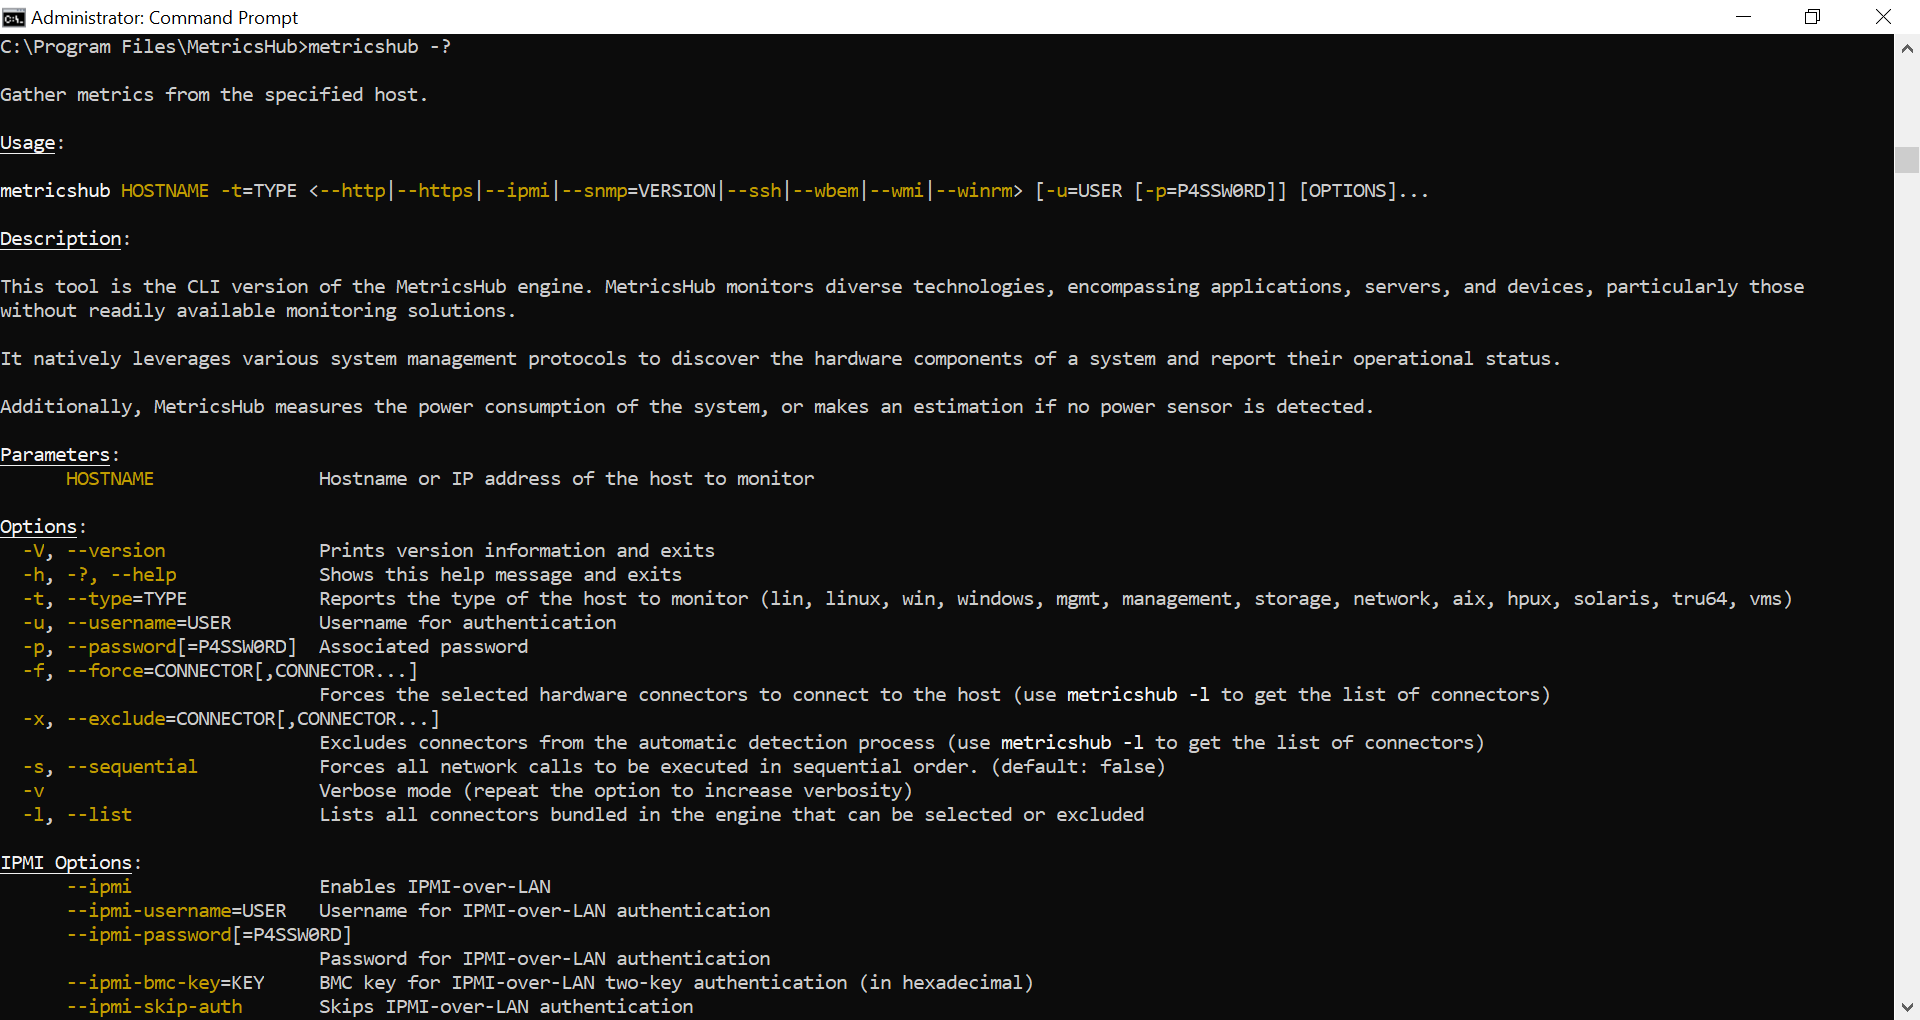
To learn more about the various options available, simply run the below command:
$ metricshub -h
Verbose Modes
To get additional details about the operations performed by the MetricsHub Engine, run:
-vto display internal warning messages (WARN)-vvto get details about each operation performed (INFO)-vvvto get initialization and connections details (DEBUG)-vvvvto get full visibility about what is happening (TRACE)
Examples
Storage System, REST API
$ metricshub STOR01 -t storage --https -u USER
This command will connect to the STOR01 storage system in HTTPS (port 443 by default) and check whether a known REST API responds with the USER credentials. The password will be asked for interactively. Use the -p P4SSW0RD option to specify the password directly in the command line (not secure!).
Linux, SNMP v1
$ metricshub HOST02 -t linux --snmp 1 --community COMM02
This command will connect to the HOST02 Linux system using SNMP version 1 and the COMM02 community. If a known SNMP agent is running on this host, metricshub will leverage it to discover the physical components of the system and collect various metrics.
Note: If no SNMP community is specified, public is assumed by default.
Storage System, SNMP v2c
$ metricshub CISC03 -t sto --snmp 2
This command will connect to the CISC03 SAN switch (storage) using SNMP version 2.
Note: SAN switches fall into the Storage category of systems, like disk arrays and tape libraries, and not in the
Networkcategory, like network switches and IP routers.
Windows, WMI and SNMP v2c
C:\Program Files\MetricsHub> metricshub WIN04 -t win --snmp 2 --wmi
This command will connect to the WIN04 Windows system using SNMP version 2 with the public (default) community, and WMI as the current.
Note: The WMI protocol can only be used from a Windows system to monitor another Windows system.
Windows, WMI and WBEM (Alternate Credentials)
C:\Program Files\MetricsHub> metricshub WIN05 -t win --wbem --wbem-username USERA --wmi --wmi-username WINUSER
This command will connect to the WIN05 Windows system using WBEM as USERA, and WMI as WINUSER. The WBEM and WIM passwords will be asked for interactively.
Note: Instead of using the common
-uor--usernameoptions, we had to use the--wbem-usernameand--wmi-usernameoptions to specify different credentials for WBEM and WMI.
Ouf-of-band Management Card, IPMI-over-LAN
$ metricshub MGMT06 -t oob --ipmi -u USER
This command will connect to the MGMT06 out-of-band management card (typically a BMC chip) using the IPMI-over-LAN protocol as USER.
VMware ESX, WBEM
$ metricshub ESX07 -t esx --wbem -u admin
This command will connect to the ESX07 VMware ESX host using the WBEM protocol (HTTPS/5989 by default) with the admin account.
VMware vCenter, WBEM
$ metricshub ESX08 -t esx --wbem -u admin --wbem-vcenter=vcenter01
This command uses the multi-tier authentication vcenter01 server, which provides a connection ticket to access the ESX08 VMware ESX host via the WBEM protocol (HTTPS/5989 by default) with the admin account.
Solaris, SSH
$ metricshub SOLAR08 -t sol --ssh -u USER --sudo-command-list /usr/sbin/dladm,/usr/sbin/ndd
This command will connect to the SOLAR08 Solaris system using the SSH protocol to execute commands as USER. sudo will be used to execute the /usr/sbin/dladm and /usr/sbin/ndd commands, as they require root privileges.
Note: The system must have been configured to allow
USERto execute these commands withsudo.
WinRM
$ metricshub WIN09 -t mgmt --winrm --winrm-username USER --winrm-password MYSECRET
This command will connect to the WIN09 system using the WinRM protocol to execute commands as USER.
Automatic Detection vs Manual Selection
MetricsHub is bundled with Community Connector Library, a library which consists of a list of connectors that describe how to discover resource components (such as hardware, service and application components) and detect failures in a given system, with a specific instrumentation stack.
Examples of connectors:
- Dell OpenManage Server Administrator (SNMP)
- Network Cards on Windows (WMI)
- IBM AIX physical disks, using system commands
- VMware ESX (WBEM)
- etc.
When running the metricshub command, the connectors are automatically selected based on the specified system type and the protocol enabled. This is the detection phase.
You can however specify manually which connectors must be used to monitor the specified host, or exclude some connectors from the list that will be tested during the detection phase.
Configure connectors
The connectors are automatically selected based on the device type provided and the enabled protocols. However, you have the flexibility to specify which connectors should be utilized or omitted.
The --connectors CLI option allows you to force, select, or exclude specific connectors. Connector identifiers or category tags should be separated by commas, as illustrated in the example below:
$ metricshub SERVER01 -t oob --snmp v2c --community public --connectors +MIB2,#hardware,-Windows
- To force a connector, precede the connector identifier with a plus sign (
+), as in+MIB2. - To exclude a connector from automatic detection, precede the connector identifier with a minus sign (
-), like-Windows. - To stage a connector for processing by automatic detection, configure the connector identifier, for instance,
MIB2. - To stage a category of connectors for processing by automatic detection, precede the category tag with a hash (
#), such as#hardwareor#system. - To exclude a category of connectors from automatic detection, precede the category tag to be excluded with a minus and a hash sign (
-#), such as-#system.
Examples
-
Example 1:
$ metricshub SERVER01 -t win --snmp v2c --community public --connectors "#hardware"The core engine will automatically detect connectors categorized under
hardware. -
Example 2:
$ metricshub SERVER01 -t win --wmi --connectors -#hardware,#systemThe core engine will perform automatic detection on connectors categorized under
system, excluding those categorized underhardware. -
Example 3:
$ metricshub SERVER01 -t win --snmp v2c --community public --wmi --connectors MIB2NT,MIB2,#systemThe core engine will automatically detect connectors named
MIB2NT,MIB2, and all connectors under thesystemcategory. -
Example 4:
$ metricshub SERVER01 -t win --snmp v2c --community public --wmi --connectors +DiskPart,MIB2,#systemThe core engine will force the execution of the
DiskPartconnector and then proceed with the automatic detection ofMIB2and all connectors under thesystemcategory. -
Example 5:
$ metricshub SERVER01 -t win --wmi --connectors DiskPart,-#systemThe core engine will perform automatic detection exclusively on the
DiskPartconnector. -
Example 6:
$ metricshub SERVER01 -t win --snmp v2c --community public --connectors +Windows,MIB2The core engine will force the execution of the
Windowsconnector and subsequently perform automatic detection on theMIB2connector. -
Example 7:
metricshub SERVER01 -t win --snmp v2c --community public --connectors -LinuxThe core engine will perform automatic detection on all connectors except the
Linuxconnector. -
Example 8:
metricshub SERVER01 -t win --snmp v2c --community public --connectors "#hardware,-MIB2"The core engine will perform automatic detection on connectors categorized under
hardware, excluding theMIB2connector.
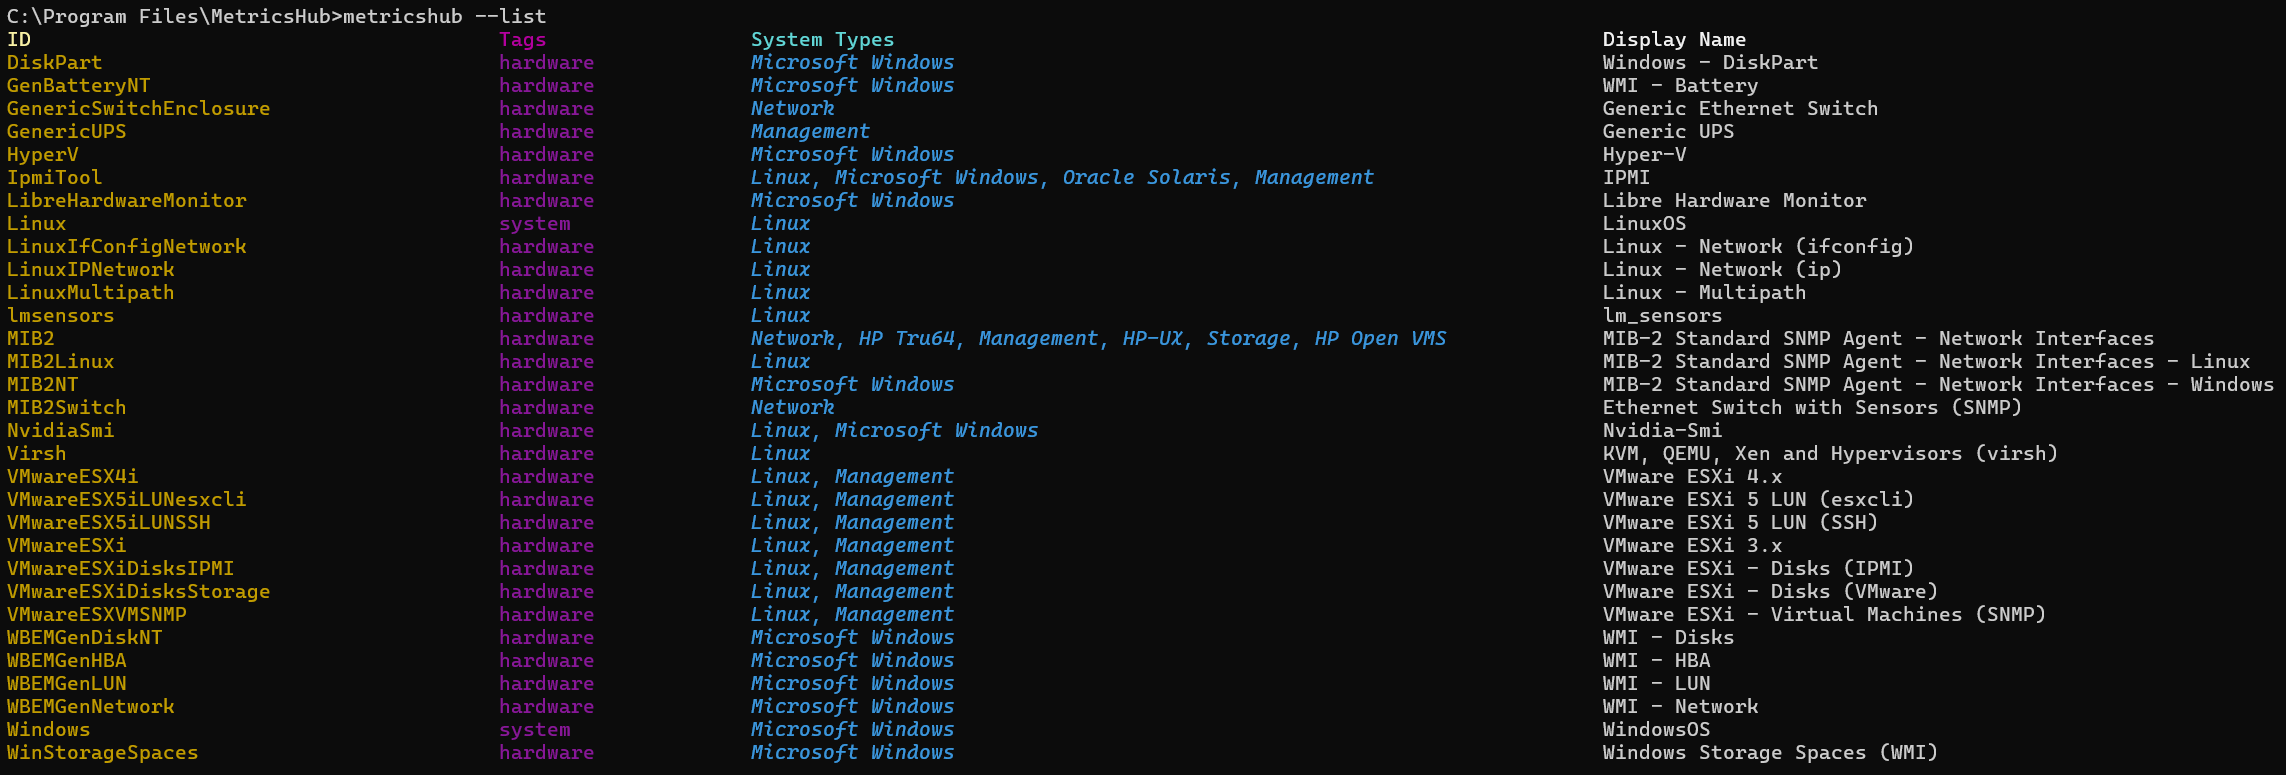
To get the list of connectors bundled in MetricsHub and their corresponding internal name (id), you can run the below command:
$ metricshub --list
This will provide a list as below:

This list displays the internal name (id) of each connector, its applicable system types and its display name.
Sequential Mode
By default, the MetricsHub Engine sends the queries simultaneously to the host resource. Although the parallel transmission is faster than the sequential one, too many requests at the same time can lead to the failure of the targeted host resource.
Use the --sequential option to force all the requests to be executed in a sequential order, thus the monitored host is not overloaded.
$ metricshub SERVER01 -t linux --snmp 1 --community COMM02 --sequential
Iterations
You can run the collect operation many times (e.g: to compute energy or rate metrics, you need to run it at least twice).
Use --iterations option to define the number of times the collect operation will be executed and --sleep-iteration to define the duration in seconds of the pause between two collect operations.
$ metricshub SERVER01 -t oob --snmp v2c --community public --iterations 2 --sleep-iteration 5

