Blog
How We Achieved 100% Monitoring Coverage in Grafana Using MetricsHub
Over 80 systems from 20 different vendors monitored in one unique console!

Taha Chkir is a senior system administrator with over 10 years of experience in systems administration in both small and mid-size companies. He is responsible for support, troubleshooting, and server and network maintenance. He has been challenged to set up a demo platform to showcase the integration of MetricsHub® in Grafana. He agreed to share his experience in this post.
So, Taha, tell us how the project started.
Well, it started with the need to showcase MetricsHub’s capabilities in reporting hardware health metrics and sustainability KPIs in comprehensive and user-friendly dashboards. As MetricsHub dashboards were generally available from Grafana Labs, the choice of Grafana was obvious.
The Hardware (MetricsHub) dashboards would expose actual data for potential customers to understand the value of our product in a real-life context. Also, it would be a great help to our marketing and communication teams to support their efforts in promoting MetricsHub.
How did you prepare to take on the challenge?
First, I needed a clear view of all our servers, storage systems, and network switches to ensure no hosts - even the smallest PCs used for development purposes - were left unmonitored.
With this exhaustive list in hand, I configured MetricsHub to monitor them all. I worked closely with the entire team to identify the best protocol to use among SNMP, IPMI, HTTP, WBEM, WMI, WinRM, and SSH, as well as the credentials required.
Once the monitoring was set up, I configured MetricsHub to push the collected metrics to the Prometheus server and I loaded the Hardware (MetricsHub) dashboards in Grafana™.


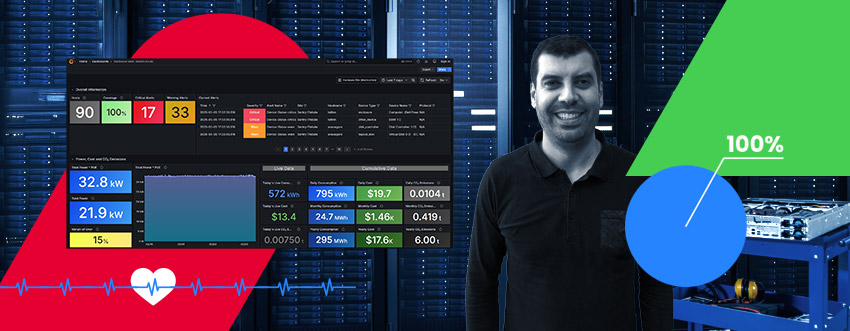
MetricsHub Monitored 100% Of Their IT Infrastructure in Grafana
The final steps involved testing the integration to identify bugs and areas for improvement and provide feedback from the field to the development team.
Does the outcome meet your expectations?
In only two weeks, I was able to provide a Grafana platform showing the hardware health and performance metrics of 80 hosts from a dozen different vendors (Brocade, Dell, Hitachi, HP, Huawei, IBM, Pure Storage, and more), proudly reaching a 100% monitoring coverage.

MetricsHub monitored hosts from a dozen different vendors in Grafana
What did you learn from this project?
My first observation is that MetricsHub is easy to use and configure! The product requires minimal configuration as it auto-discovers all servers, network, and storage vendors when the configuration file is populated with the correct hostnames and credentials. Also, the standardization of the metrics across any system brand and model makes the dashboard very easy to read and facilitates data analysis.
I’d say that any IT administrator can start using MetricsHub on their own. Of course, they can rely on the documentation to get extra information and tips or browse specific use cases.
In the context of complex environments or difficult technical monitoring challenges, users can also benefit from the MetricsHub Support team’s expertise, which can help them get operational faster.
Testing MetricsHub in a real-world environment also allowed me to pinpoint some enhancements our customers could benefit from. It means an even better product version is coming soon!
Speaking of the future, what’s coming next?
Now that the monitoring of the infrastructure is set up, I want to send the Telemetry data to the other observability platforms currently supported by MetricsHub, i.e. Datadog, Splunk, or BMC Helix.
View MetricsHub Live Try it free Talk to an expert

