Blog
The Heartbeats of the Digital World E03: Layers of Monitoring
In this third episode, Alex and James explore the critical differences between hardware and operating system monitoring in data centers. Their discussion highlights the importance of proactive monitoring and introduces MetricsHub as a potential integrated solution for managing diverse monitoring tasks.

James took a couple of days to process the gravity of data center outages. He is now ready to take another sip of his coffee and is eager for more knowledge from his data center specialist friend, Alex.
James: Alex, you’ve mentioned hardware failures and software failures. Can you explain more about how monitoring hardware is different from monitoring operating systems like Windows or Linux?
Alex: Absolutely, James. Monitoring hardware and monitoring operating systems are both crucial, but they serve different purposes and involve different techniques. Let’s break it down and start with hardware monitoring.
James: Okay, I am all ears!
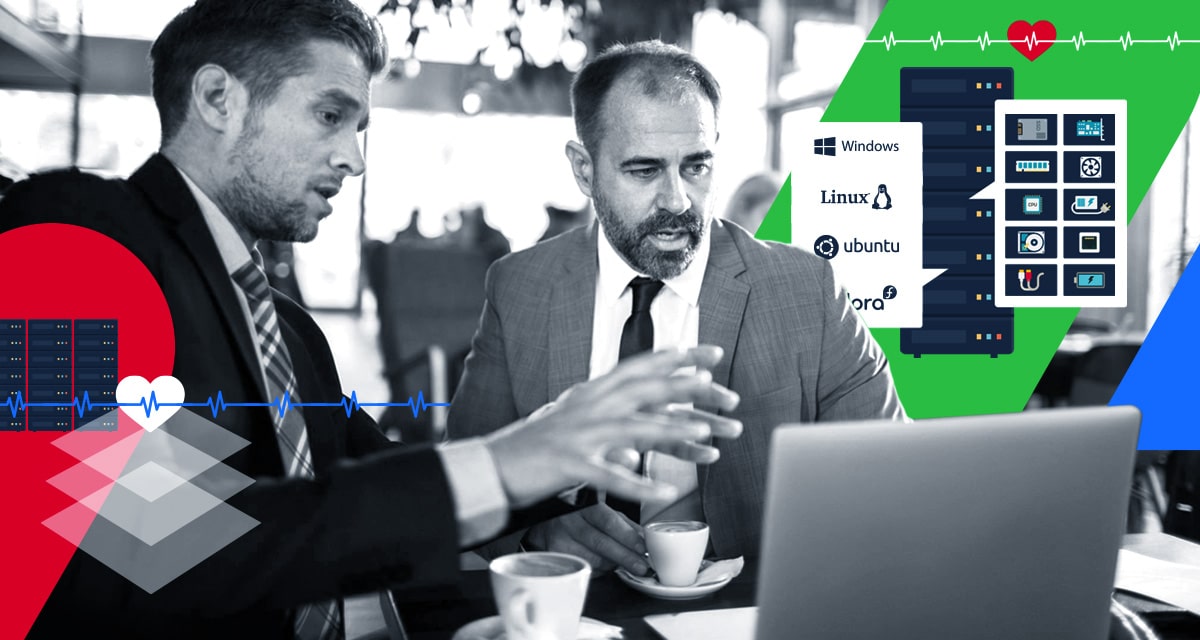
Alex: Hardware Monitoring is about keeping on an eye on the physical components of a data center. This includes servers, storage devices, network equipment, power supplies, and cooling systems. We use specialized tools and sensors to track parameters like temperature, humidity, power consumption, fan speeds, disk health, and network traffic. The objective is to detect signs of wear and tear, potential failures, or unusual activity that could indicate a problem.
James: So, it’s like checking the vital signs of the hardware?
Alex: Exactly. For example, we might use SMART (Self-Monitoring, Analysis, and Reporting Technology) data to monitor hard drives for signs of imminent failure. Or we use SNMP (Simple Network Management Protocol) to gather data from network devices. The idea is to catch issues early – like a server running hotter than usual, which might suggest a cooling problem, or a power supply showing irregular voltage levels.
James: That makes sense. Now, what about monitoring operating systems?
Alex: Operating System Monitoring focuses on the software layer that runs on the hardware. Whether it’s Windows, Linux, or another OS, we’re interested in the performance and health of the system. This includes tracking CPU usage, memory usage, disk space, process activity, and application performance. We use tools like Windows Performance Monitor or Linux tools like top, htop, and system logs.
Hardware monitoring ensures that the foundation – the physical components – is in good shape. OS monitoring ensures that the software built on top of that foundation runs efficiently.
James: So, OS monitoring is more about how efficiently the system is running and less about the physical condition of the hardware?
Alex: Exactly. For example, we might monitor the load average on a Linux server to ensure it’s not overloaded or track specific services on a Windows server to ensure they’re running smoothly. It’s about ensuring the OS and applications are functioning correctly, responding quickly, and not experiencing errors.
James: How do these two types of monitoring work together?
Alex: They complement each other. Hardware monitoring ensures that the foundation – the physical components – is in good shape. OS monitoring ensures that the software built on top of that foundation runs efficiently. For instance, if a server’s performance drops, OS monitoring might show high CPU usage, while hardware monitoring might reveal that the CPU is overheating. This helps us diagnose whether it’s a software issue, a hardware issue, or both.
James: That’s a good point. So, you need both to get the full picture.
Alex: That’s right. Ignoring one could leave you blind to certain issues. For example, without hardware monitoring, you might miss a failing disk drive that could lead to data loss. Without OS monitoring, you might miss a memory leak in an application that could cause the system to crash.

James: What tools do you use for these tasks?
Alex: There are many tools. For hardware monitoring, we might use IPMI (Intelligent Platform Management Interface), iDRAC (Integrated Dell Remote Access Controller) for Dell servers, or ILO (Integrated Lights-Out) for HP servers. For OS monitoring, there are tens of tools out in the market. They can often be integrated to provide a comprehensive view.
James: Got it. So, having a robust monitoring strategy involves both hardware and software tools, working together to keep the data center healthy.
Alex: Exactly. And remember, proactive monitoring helps prevent outages by identifying and resolving issues before they escalate. It’s all about maintaining that heartbeat of the digital world.
James: However, that’s a long list of tools to keep the data center efficient. Is there a single tool that could monitor both hardware and the OS?
Alex: That’s a great question, James. Yes, that’s for sure. It is a tool sprawl. I am now trying out the Beta version of the MetricsHub Community Edition to consolidate siloed tools.
James: Can you tell me more about it?
Alex: I am running out of time today, but I will tell you more about it at our next coffee break! Talk to you soon!
James left grateful for the insights. He realized that understanding the intricacies of data center monitoring was essential for anyone working in IT. With this new knowledge, he felt better prepared to face the challenges ahead, knowing that each layer of monitoring played a vital role in keeping the digital world running smoothly. However, he got curious about what is so great about MetricsHub, that Alex and the team are evaluating to manage their data center.
What about you? Do you monitor Windows or Linux but not the underlying hardware? What do you do when there is hardware failure on servers hosting your most critical ERP applications or databases? Join our MetricsHub Slack Workspace and let us know your thoughts, experiences, or challenges.

