Blog
How Many Systems Can a Single MetricsHub Agent Monitor?
To give our users a solid answer backed by real data, we recently conducted an in-depth load testing experiment using server emulation and real-world lab systems. Here's what we did, what we learned, and how you can interpret these findings for your own environments.

Introduction
“How many systems can I monitor with a single agent?” is one of the most common questions we get at MetricsHub. As simple as this question may sound, the answer is quite complex. It depends on several variables—such as the type of systems monitored, the communication protocol used, and the number of components per system. Monitoring a single server is one thing; monitoring a high-end storage system with thousands of volumes is something entirely different.
Test Methodology
Simulating Diverse Environments
We simulated a monitoring environment reflecting the diverse mix our customers typically deal with. Our emulations were based on the following protocols:
- SNMP, which is traditionally known for being lightweight
- HTTP REST API, which is increasingly common in modern IT infrastructures, although more demanding.
The simulated systems included the devices most monitored by MetricsHub:
- HP ProLiant servers
- Dell PowerEdge servers
Integrating Real Systems
To ensure realistic performance results, we also integrated a selection of real systems from our internal lab, including:
- Regular Linux and Windows servers
- NetApp and Pure Storage systems

Monitoring Setup
To track the health of our testing infrastructure and agents, we used:
- MetricsHub dashboards available on Grafana Labs
- Monitoring Studio X, a monitoring toolbox developed by Sentry Software
This setup allowed us to monitor:
-
The MetricsHub Agent itself

-
The Prometheus server

-
the Grafana server

-
Key metrics such as CPU usage, memory consumption, and job queue status

Key Findings
Finding #1: Protocol Matters (A Lot)
- SNMP allows scaling efficiently and remains a go-to for lightweight monitoring.
- HTTP/REST introduces heavier loads
Finding #2: Agent Tuning is Critical
The MetricsHub Agent offers several parameters that can be tuned to enhance performance. One of the most impactful was jobPoolSize, which governs how many jobs the agent can handle concurrently.
Proper tuning ensured smooth performance even under heavy load.
Finding #3: Keeping an Eye on the Monitors Pays Off
Monitoring Studio X offered a real-time view of the health and behavior of the monitoring stack and was essential in:
- Preventing resource bottlenecks
- Understanding how changes impacted performance
- Planning future scalability strategies
Practical Recommendations
Based on our tests, we recommend:
- Starting with SNMP whenever possible since it is lighter and sufficient for many server types.
- Monitoring your agent resources closely and tuning parameters like jobPoolSize if using REST.
- Using a secondary monitoring layer (in our example, Monitoring Studio X) to observe agent behavior and system health under load.
- Assessing your system complexity: A single high-end storage array might consume more resources than 50 standard servers.
Real-Time Monitoring Stats
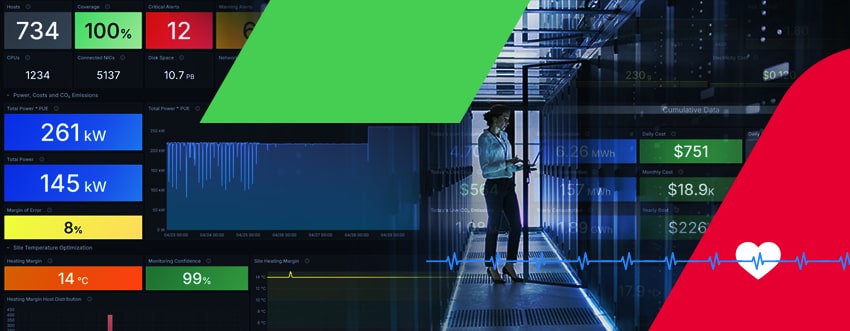
At the end of our load test, a single MetricsHub Agent was successfully monitoring 734 systems, including:
- 200 Dell PowerEdge 740 XD systems via SNMP v2c
- 200 Dell PowerEdge R640 systems via HTTP REST
- 200 HP ProLiant DL380 systems via SNMP v2c
- 100 HP Synergy 480 systems via HTTP REST
- additional lab systems (Pure, NetApp, and others.)

We proudly achieved 100% monitoring coverage, meaning every system was actively reporting data and fully represented in MetricsHub dashboards.

This was made possible by leveraging a mix of protocols and notably:
- SNMP: 48%
- HTTP (REST): 48%
- SSH/WMI/Other protocols: 4%
Conclusion
While there’s no one-size-fits-all answer, our testing shows that with proper configuration, a single MetricsHub Agent can reliably monitor hundreds of systems, even with a mix of protocols. Currently, we have reached 734 monitored systems with full coverage—and the system is holding strong.
Have questions about how this applies to your infrastructure? We’d love to help. Contact our support team or start a conversation in the MetricsHub community.

