Blog
A Journey into OpenTelemetry: Building the BMC Helix Exporter
Discover how a simple idea grew into a powerful OpenTelemetry Collector component that connects observability pipelines to BMC Helix Operations Management.
Hi there! I’m Nassim, and I’d love to share with you the story of how we brought the BMC Helix Exporter to life in the OpenTelemetry Collector Contrib repository.
Whether you’re an observability enthusiast, a fellow contributor, or someone exploring OpenTelemetry, I hope this inspires you to contribute.
A Typical Deployment Architecture
In many enterprise environments, you have a wide variety of systems generating valuable telemetry. Think:
- Physical servers from vendors like HPE and Dell
- Linux and Windows machines running workloads
- Databases such as Oracle, MySQL, or PostgreSQL
- Applications—either custom-built or third-party software
These systems are observed through different monitoring tools, such as:
- MetricsHub Enterprise for deep hardware and system telemetry
- Node Exporter for Prometheus-style host metrics
- Telegraf for plugin-based metric collection across dozens of input sources
All this telemetry needs to land somewhere useful—enter the OpenTelemetry Collector.
Inside the OTEL Collector, we define a simple, composable pipeline:
- Receivers gather metrics from the above tools
- Transform Processor uses OTTL to reshape and enrich metrics (e.g., set
entityName,entityTypeId) - BMC Helix Exporter sends metrics directly to BMC Helix Operations Management via REST API
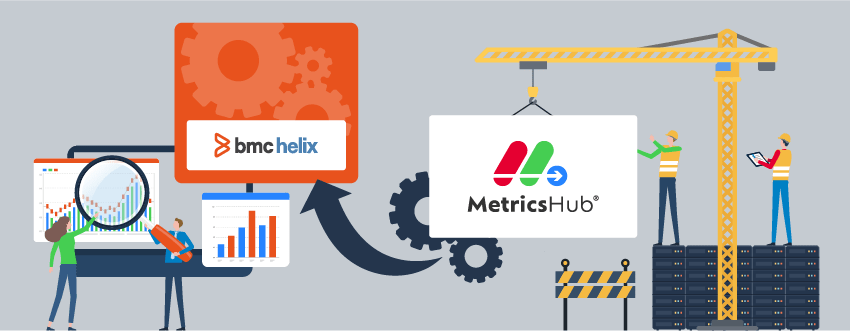
This architecture offers a flexible and vendor-neutral way to build your observability stack, following open standards.

Example of a typical deployment architecture
The Spark: Why a BMC Helix Exporter?
OpenTelemetry (OTEL) has become the gold standard for collecting metrics, traces, and logs in a vendor-neutral way. Unfortunately, there was no official exporter to send OTEL metrics to BMC Helix Operations Management via its REST API.
So the idea came naturally: let’s develop an exporter that will enable BMC Helix users to build standardized observability pipelines using OpenTelemetry and to plug them seamlessly into their observability platform.
The First Step: Creating the GitHub Issue
Like all good open source stories, it began with a GitHub issue.
On December 11, 2024, I created issue #36773 in the OpenTelemetry Collector Contrib repository. I explained our motivation, the API endpoints we planned to use, and how the exporter would be structured.
But creating the issue was just the first baby step.
Reaching Out to the Community
Next, I went to the OpenTelemetry Slack and introduced myself to the community.
“Hi everyone! 👋 I’ve created an issue to propose a BMC Helix Exporter… We’d love to contribute this to the Collector Contrib repo, but we’re looking for sponsors to support the component…”
To be honest, I was a little nervous, but full of hope. Sponsorship is needed for new components in contrib, and I wanted to build it the right way with the support of the community.
The “Oops” Moment: You Must Be a Member
Shortly after, I got a gentle and helpful message from a maintainer:
"@NassimBtk needs to be a member of the OpenTelemetry community to be a codeowner…"
Ah! I had missed that part. But no worries, I quickly submitted a membership request and was warmly welcomed into the OpenTelemetry community.
It was a small step for me, but a meaningful one. It felt like being officially invited to a dinner table I had admired for so long.
Two Awesome Sponsors Join
With community membership complete, we were ready to move forward—and that’s when the real joy came.
We were sponsored by two wonderful contributors:
- @MovieStoreGuy from Splunk
- @fatsheep9146 from Alibaba Group
Their support was more than just a green light—it was encouragement, validation, and a warm welcome into a truly global effort. We’re so grateful for their trust.
Building the Foundation: The First PR
The first pull request was all about laying the groundwork. Following the contributing guide, we didn’t jump into business logic right away.
Instead, we:
- Created the README, config and factory
- Registered our exporter in
metadata.yaml - Set the component’s stability to the
developmentlevel and implemented its lifecycle methods
It might sound boring but it’s essential. A solid foundation helps contributors (and future maintainers!) understand and extend the component.
Real Logic: Processing and Sending Metrics
The second PR was the heart of the exporter. Here, we added the logic to:
- Traverse OTEL
ResourceMetrics - Collect attributes from resources and datapoints
- Construct the payload expected by BMC Helix
- Send metrics via HTTP POST
There was one important constraint: each metric in Helix must have entityName and entityTypeId. Without those, metrics are rejected.
Now, you might think—can’t we infer those attributes programmatically?
We could, but it would be fragile and hard to maintain. So instead, we chose clarity over cleverness and gave users full control.
Giving Control to Users: OTTL + Transform Processor
The real power came from combining our exporter with the transform processor using OTTL.
Here’s a simple example:
transform/hardware_for_helix:
  metric_statements:
    - context: datapoint
      statements:
        - set(attributes["entityName"], resource.attributes["id"]) where resource.attributes["id"] != nil
        - set(attributes["entityTypeId"], "battery") where IsMatch(metric.name, "hw\\.battery\\..*")
Users can prepare their data just the way Helix wants it—with a one-time configuration effort. From there, it’s smooth sailing.
By the way, there’s a great tool at ottl.run that lets you test and validate your OTTL statements in real time, super handy to preview the results before applying them.
Marking the Exporter as Alpha
Once the core logic was in, we submitted a third PR to declare the exporter’s status as Alpha.
“This component is ready for limited, non-critical workloads. Feedback welcome!”
It felt like a milestone. The exporter was real. People could use it. And we were open to learning from early adopters.
Real-World Testing: MetricsHub + BMC Helix Operations Management
With the component merged, we tested it using MetricsHub Enterprise, our solution for monitoring hardware and infrastructure.
We pushed metrics via OTEL pipelines into our new BMC Helix Exporter, and verified that data was displayed in the BMC Helix UI.


This was the moment of truth. And it worked beautifully.
Final Step: Included in Collector Contrib Build
Finally, we submitted a PR to open-telemetry-collector-releases to include the exporter in the official build.
That means: you can now use the BMC Helix Exporter directly from the OpenTelemetry Collector Contrib distribution.
Wrapping Up: A Journey of Community and Care
This journey has been so much more than writing Go code. It was about learning how a global open source project works. It was about reaching out, being patient, asking for help, and building something useful together.
We’re now proud code owners of the bmchelixexporter, and we welcome feedback, suggestions, or questions.
Got an issue? Open one here.
Want to use the code? Here’s the repo.
For BMC Helix Users: What This Means
If you’re using BMC Helix and looking for a native way to ingest OpenTelemetry metrics—this exporter is for you. Yes, it requires a small setup using OTTL once. But after that, everything flows naturally. You get the power of OTEL with the capabilities of BMC Helix.
We hope it makes your observability journey easier—and more open.
Thanks for reading! 🙏