Storage Systems
MetricsHub collects and normalizes storage health, capacity, and performance metrics from leading enterprise storage platforms and exposes them in the Storage Systems Overview (MetricsHub) and Storage System (MetricsHub) Grafana dashboards.
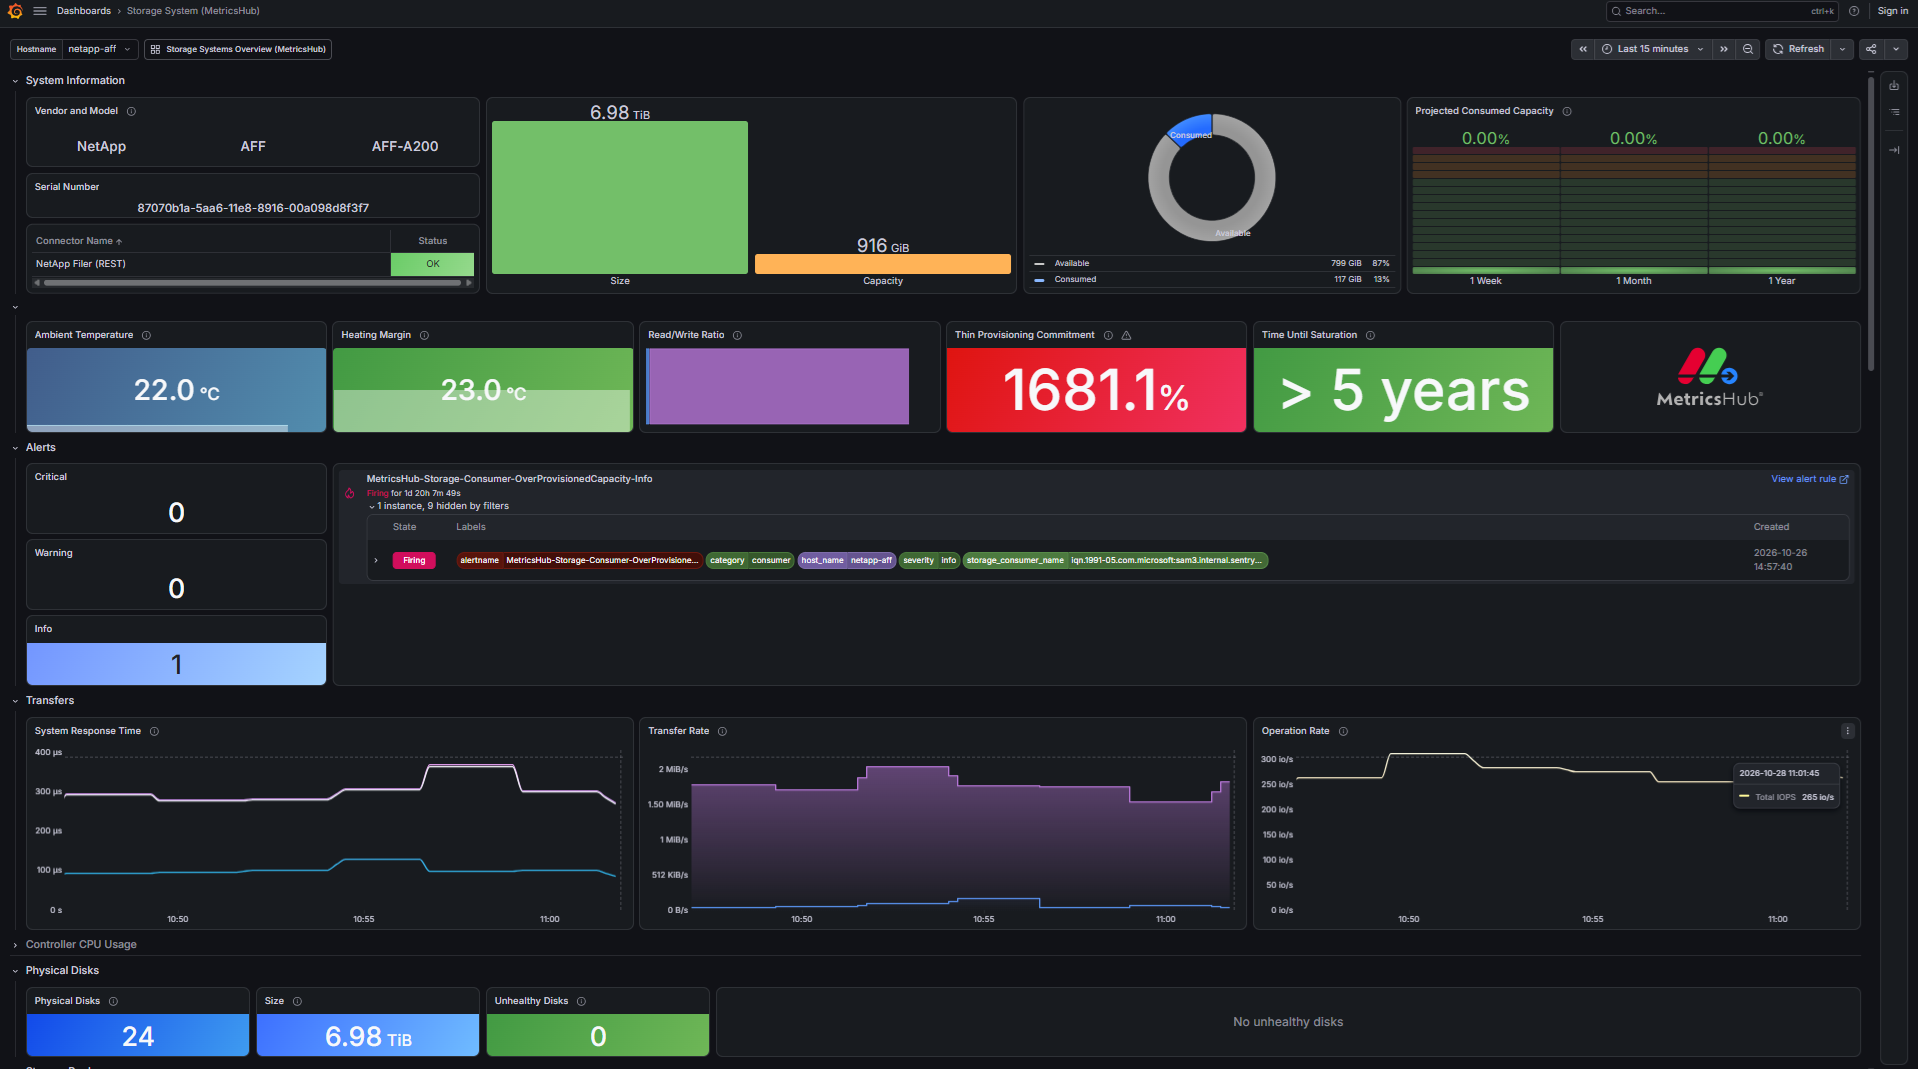
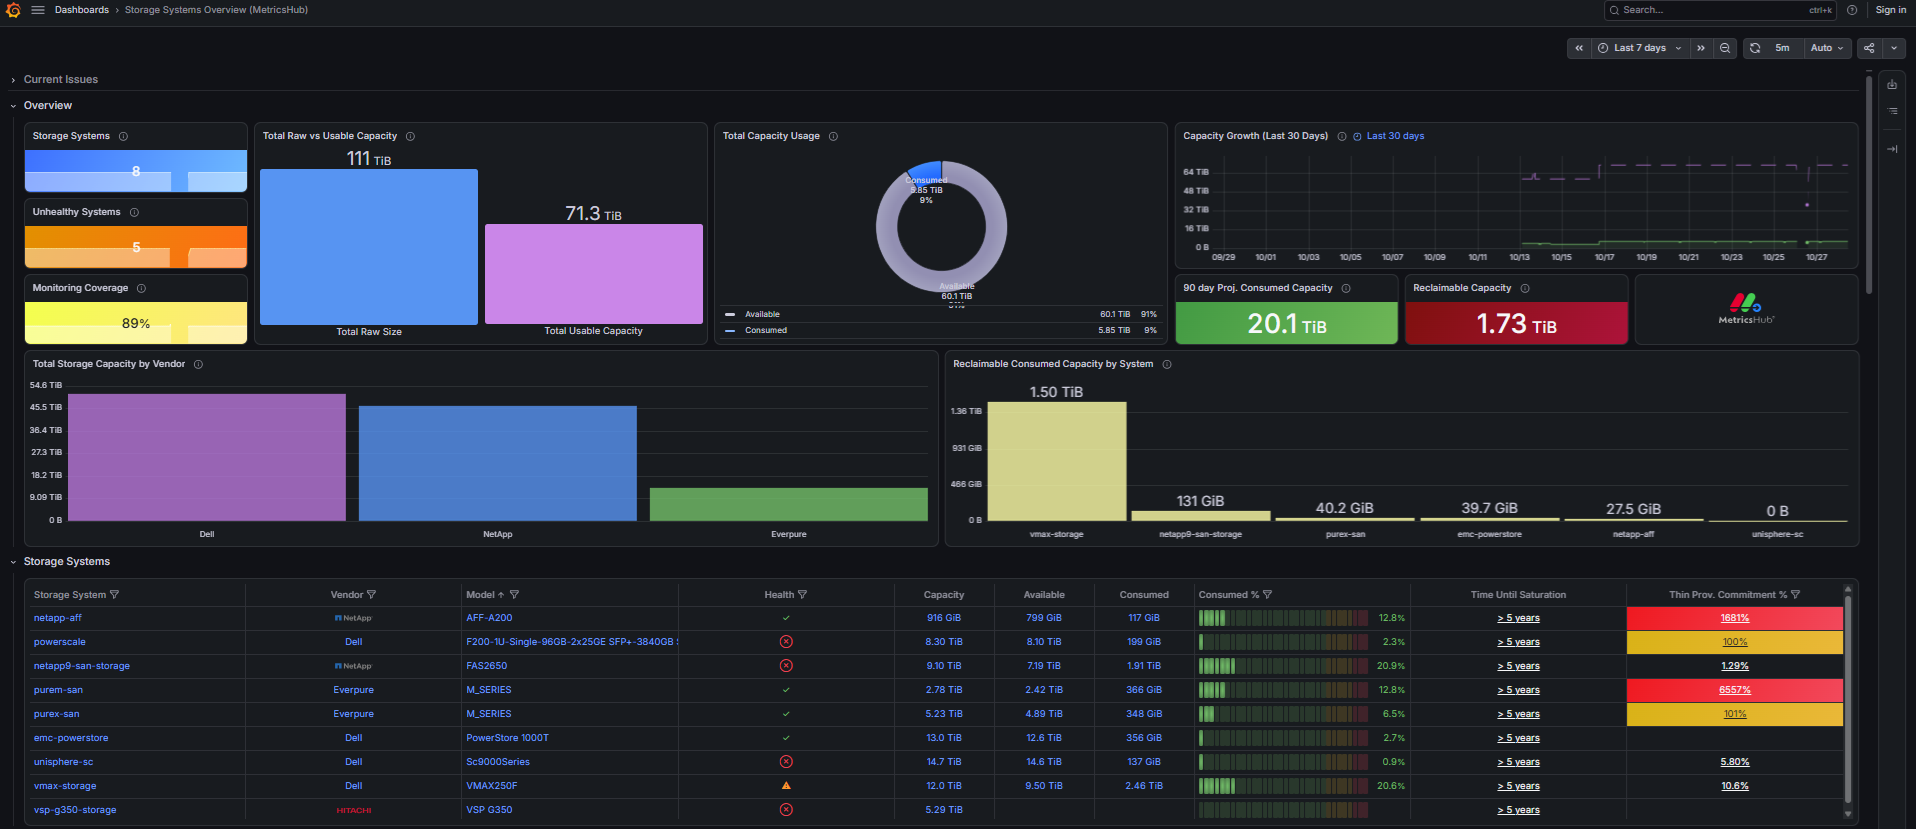
Grafana Dashboard - Storage Systems Overview (MetricsHub)
This section explains how to import these dashboards into Grafana.
Prerequisites
Before importing the Storage Systems dashboards in Grafana, ensure that you have:
- properly installed and configured a Grafana server
- configured the monitoring of your storage systems
- configured a Prometheus Server and installed the Hardware and Storage alert rules
- run MetricsHub Enterprise as well as the Prometheus and Grafana servers.
Importing the MetricsHub dashboards
- Log on to your Grafana server
- Import the dashboard(s)
- Enter one of the dashboard IDs listed below:
| ID | Dashboard | Description |
|---|---|---|
25787 | Storage Systems Overview (MetricsHub) | Monitor health, capacity, and activity across all storage systems. Identify systems that need investigation and plan capacity. |
25778 | Storage System (MetricsHub) | Investigate one storage system and its components. Analyze capacity, IOPS, throughput, and latency to troubleshoot performance issues. |
- Click Load
- Select the Prometheus data source that receives your MetricsHub metrics
- Click Import
- Repeat the procedure to import both dashboards.
The Storage Systems dashboards are now available in Grafana.