System Dashboards
MetricsHub collects and normalizes system performance metrics from AIX, HP-UX, Linux, and Windows platforms and exposes them in the System Performance Metrics – Overview (MetricsHub) and System Performance Metrics (MetricsHub) Helix dashboards.
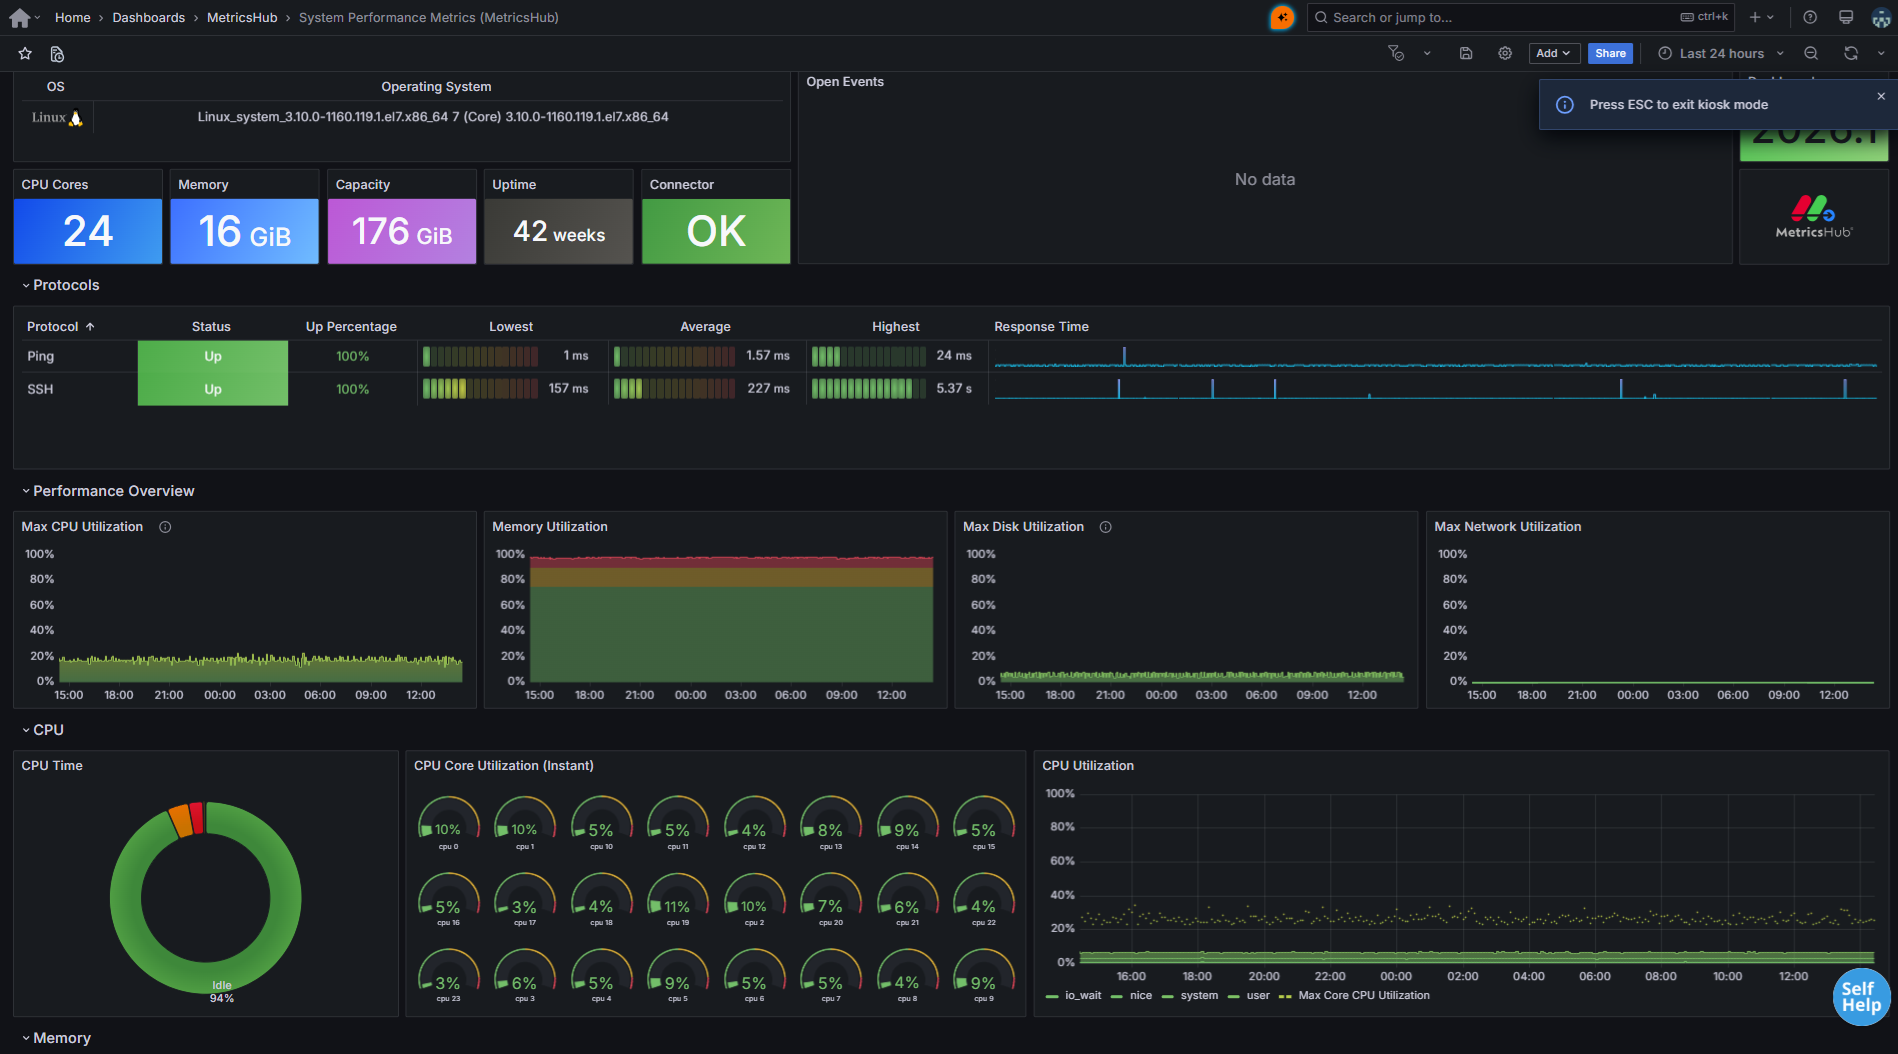
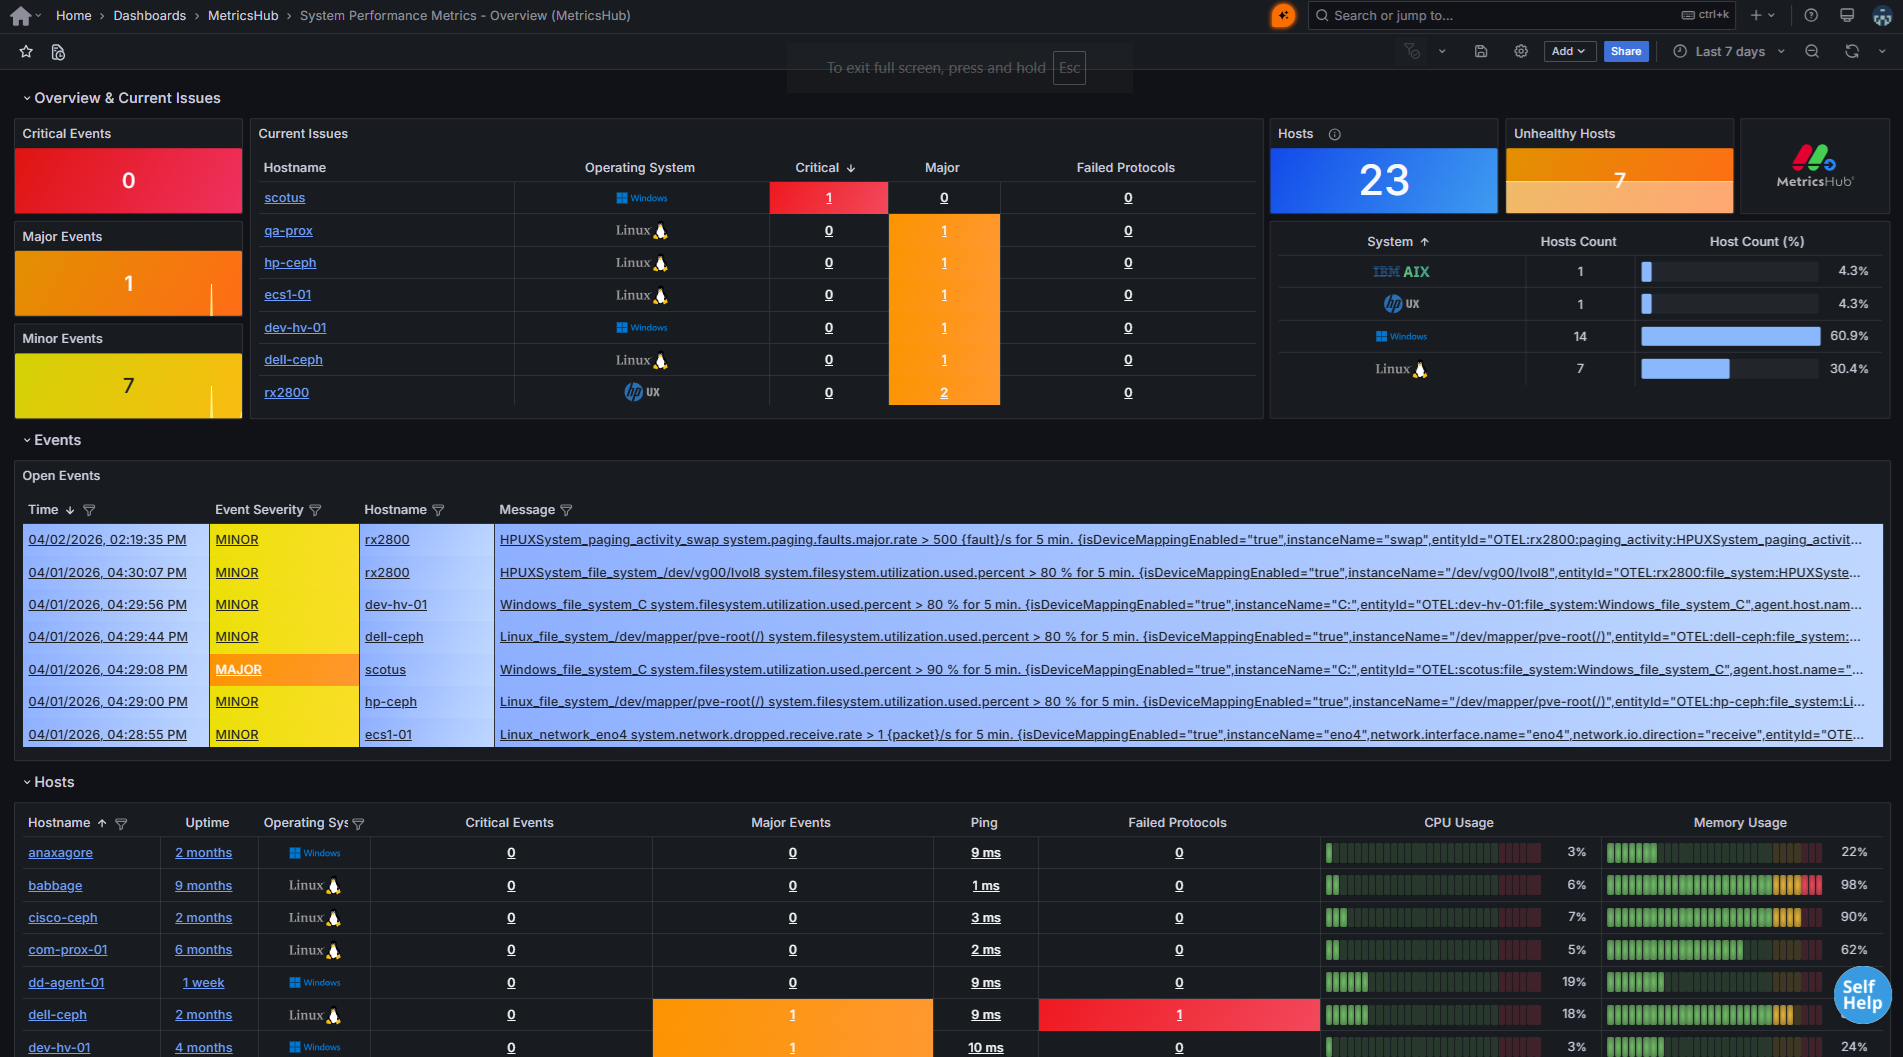
Helix Dashboards - System Performance Metrics - Overview (MetricsHub)
This section explains how to import these dashboards into BMC Helix.
Prerequisites
Before importing the System Performance Metrics dashboards in BMC Helix, ensure that you have properly configured the BMC Helix integration.
Importing the MetricsHub dashboards
-
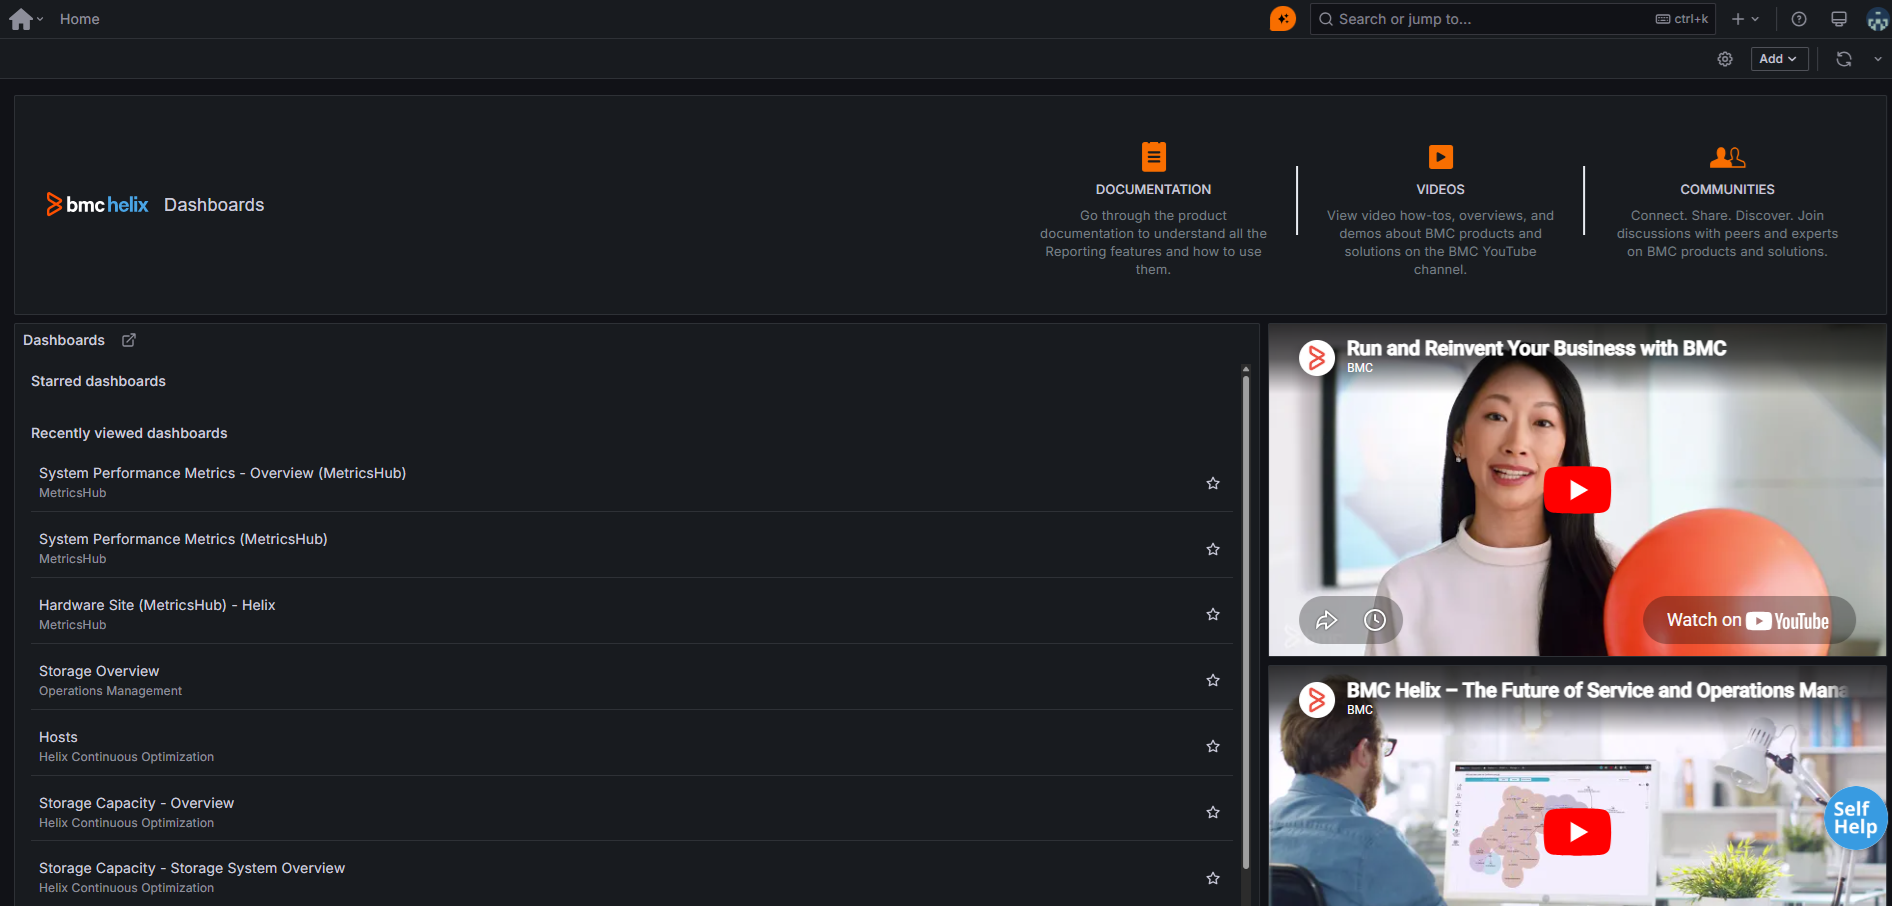
From the BMC Helix Portal, click the BMC Helix Dashboards tile
-
Click the open icon next to Dashboards
-
Click New in the top-right corner, then select Import from the dropdown menu

-
Drag and drop the following files:
| File | Description | Metrics | Usage |
|---|---|---|---|
| System Performance Metrics – Overview (MetricsHub) | Global system dashboard providing a consolidated view of system health and current issues across all monitored hosts. | Aggregated indicators across hosts, including alerts, protocol health, resource utilization (CPU, memory, storage, network), and OS distribution. | Use for situational awareness and triage. Ideal to quickly identify unhealthy systems and prioritize investigation across the infrastructure. |
| System Performance Metrics (MetricsHub) | Host-level dashboard providing detailed performance metrics, protocol health, and system metadata for a selected host. | Detailed per-host metrics, including CPU, memory, filesystem, disk, and network utilization, along with protocol performance (availability, response times) and system metadata. | Use for troubleshooting and root cause analysis. Ideal to investigate a specific host and analyze performance issues in depth. |
Click Load.