Hardware Dashboards
MetricsHub collects the hardware health and performance metrics as well as the sustainability KPIs of any server, storage system, or network switch available in your on-prem infrastructure and exposes the telemetry data in the Hardware Main (MetricsHub), Hardware Site (MetricsHub), and Hardware Host (MetricsHub) Helix dashboards.
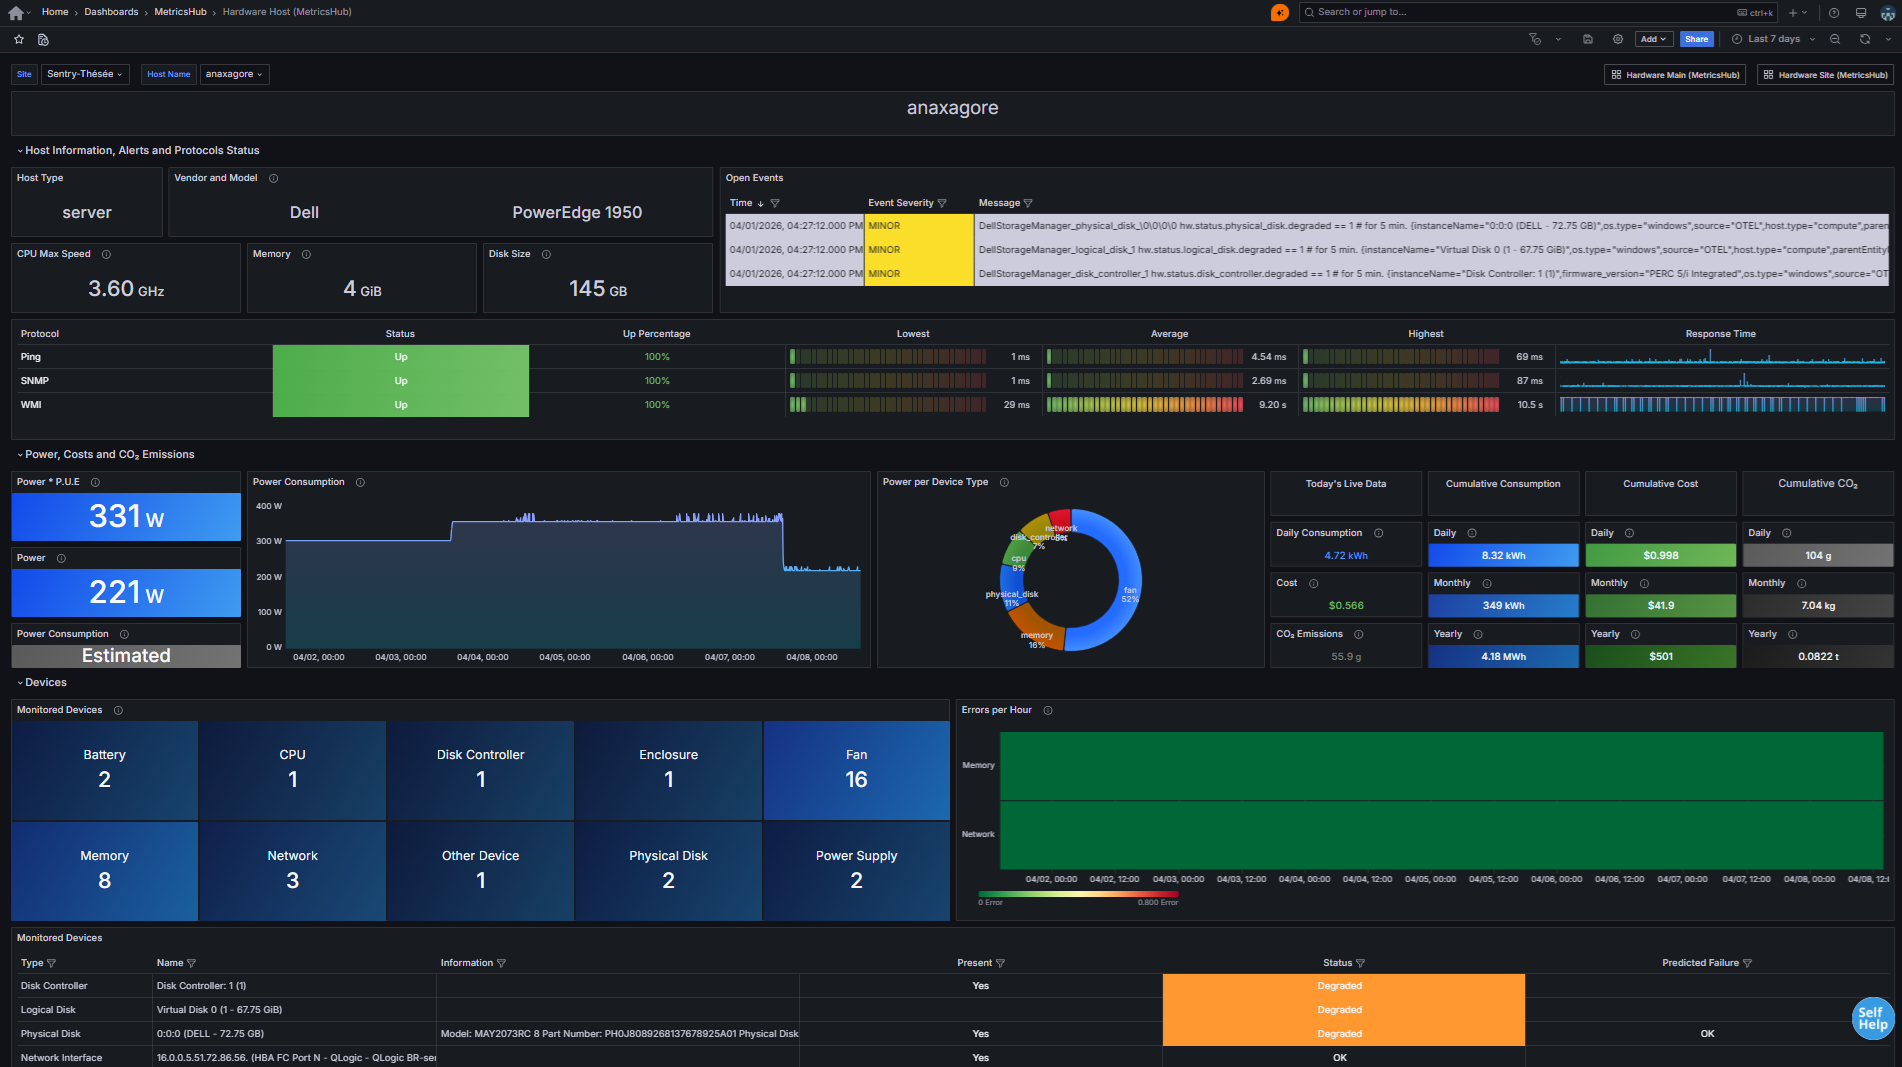
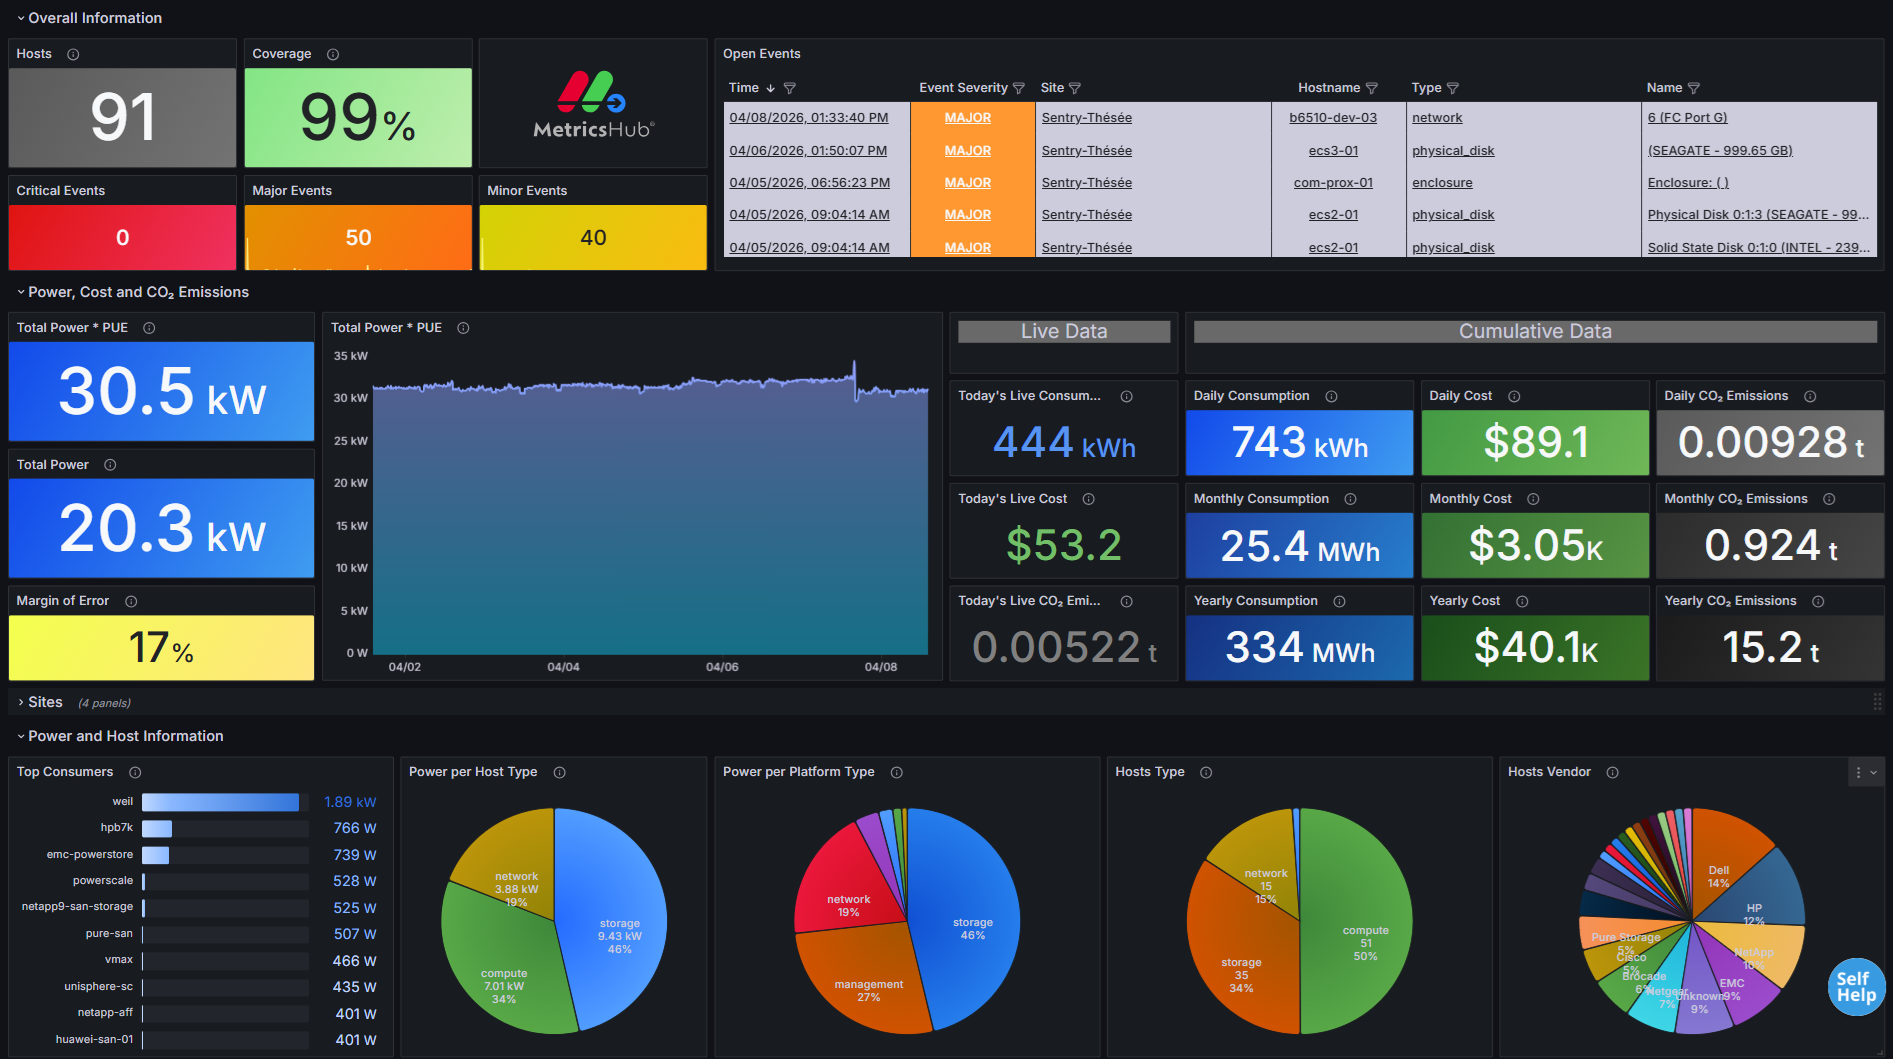
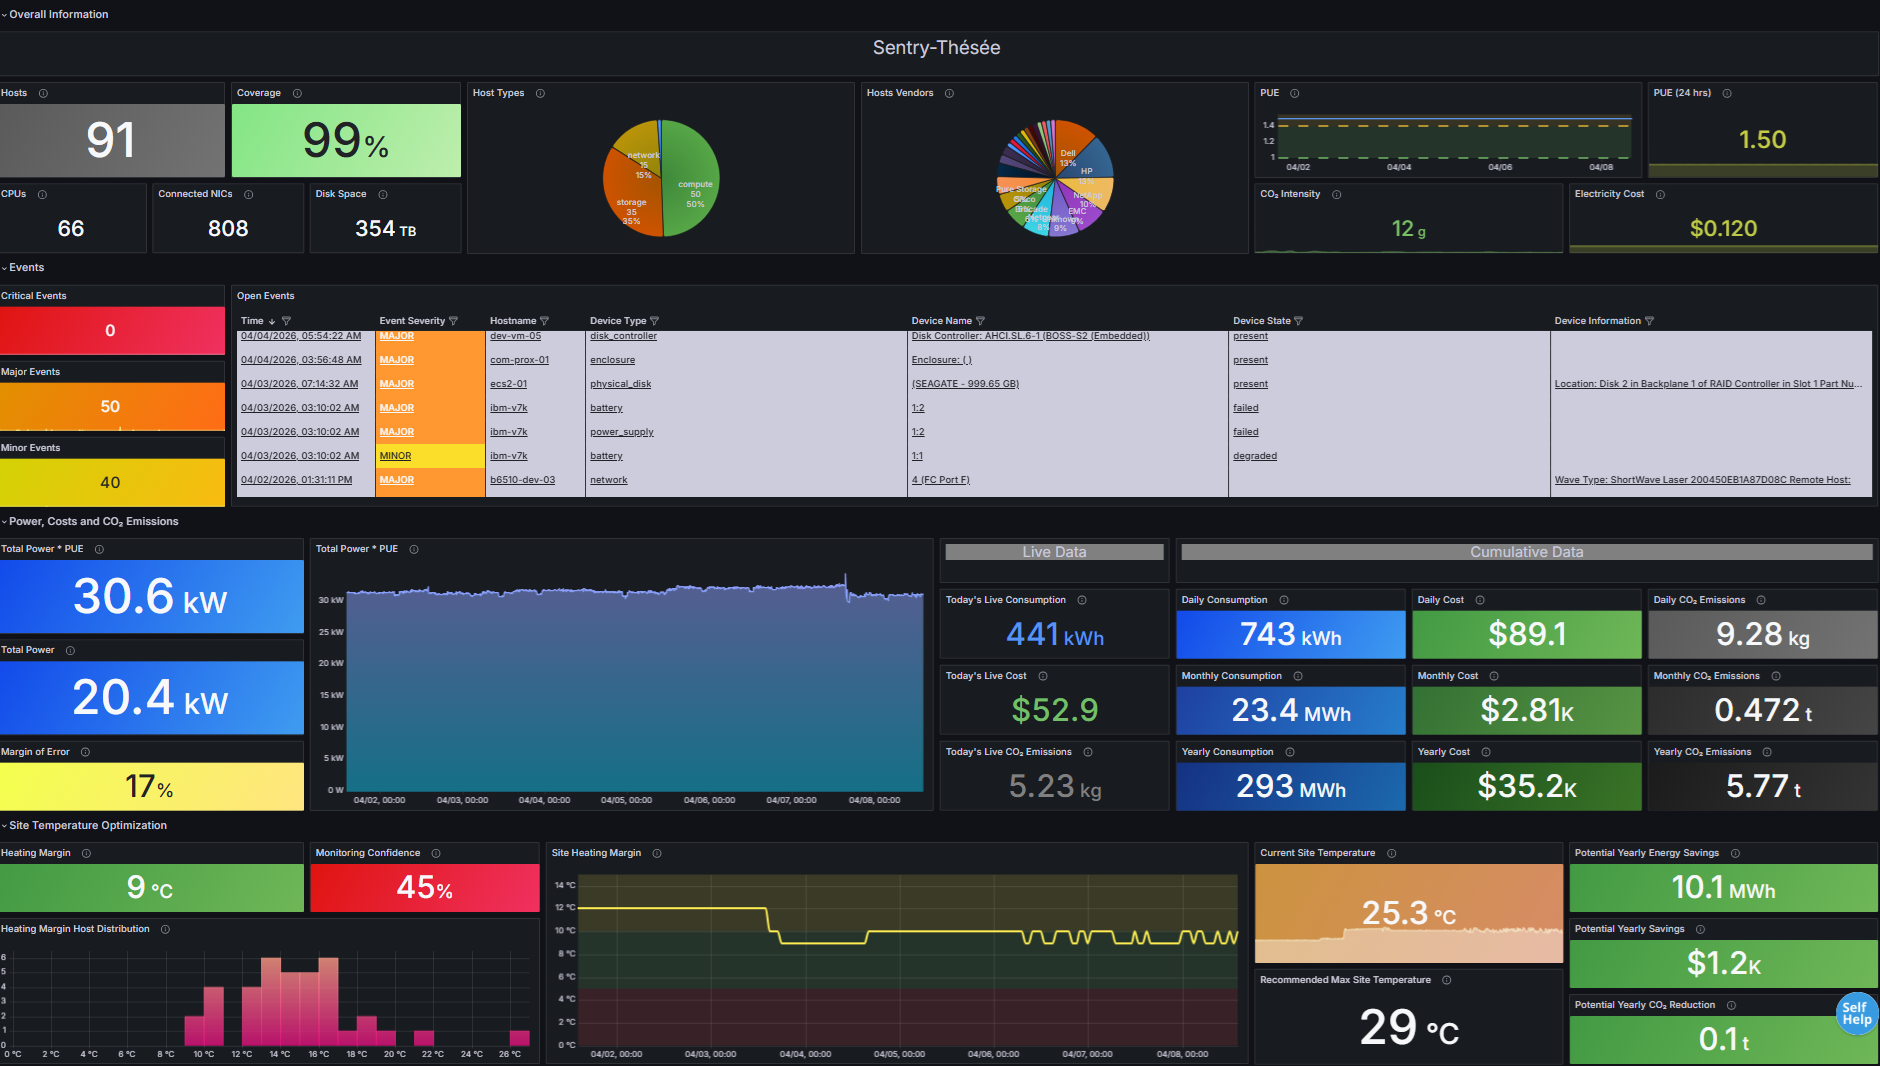
Hardware Main (MetricsHub) Dashboard - Global overview of all monitored sites, infrastructure health, energy usage, and sustainability metrics
This section explains how to import these dashboards into BMC Helix.
Prerequisites
Before importing the Hardware dashboards in BMC Helix, ensure that you have properly configured the BMC Helix integration.
Importing the MetricsHub dashboards
-
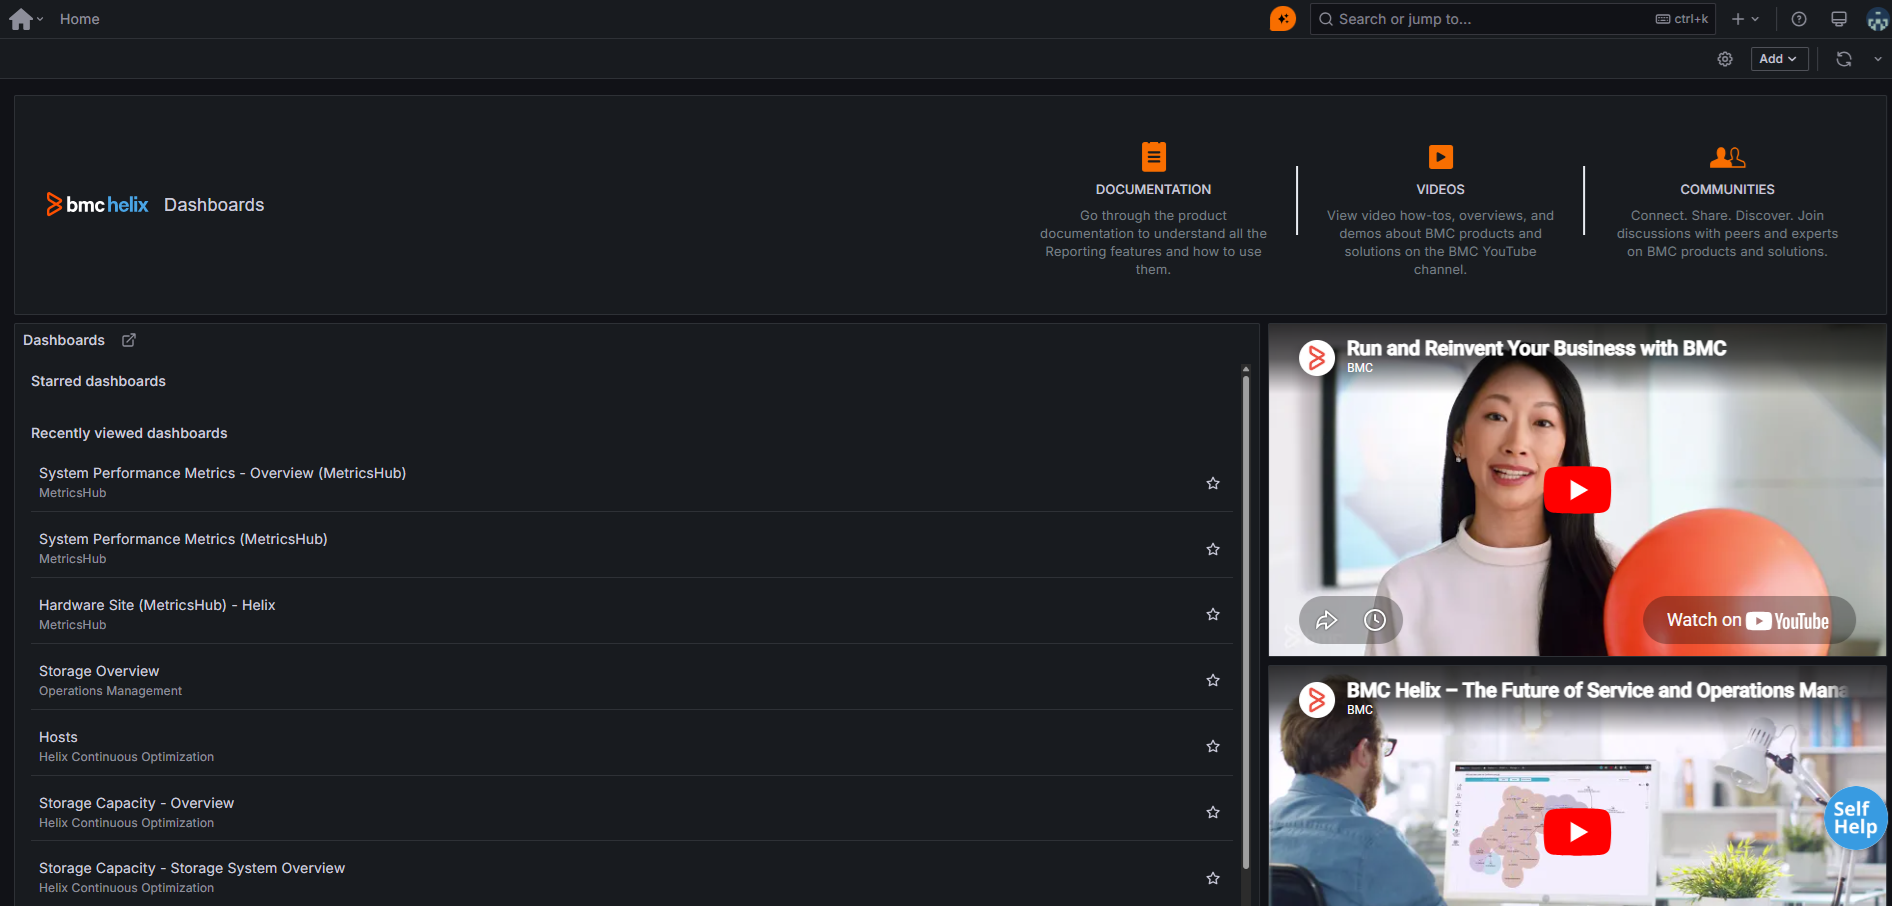
From the BMC Helix Portal, click the BMC Helix Dashboards tile
-
Click the open icon next to Dashboards
-
Click New in the top-right corner, then select Import from the dropdown menu

-
Drag and drop the following files:
| File | Description | Use Cases |
|---|---|---|
| Hardware Main (MetricsHub) | Global overview of all monitored sites, infrastructure health, energy usage, and sustainability metrics |
|
| Hardware Site (MetricsHub) | Detailed view of a specific site (data center or server room) and its monitored hosts |
|
| Hardware Host (MetricsHub) | Detailed view of a specific host and its internal components, performance, and energy footprint |
|